The terminal
What is actually in it, in the order you would meet it.
Windows and Linux, at launch
See what the chart hides
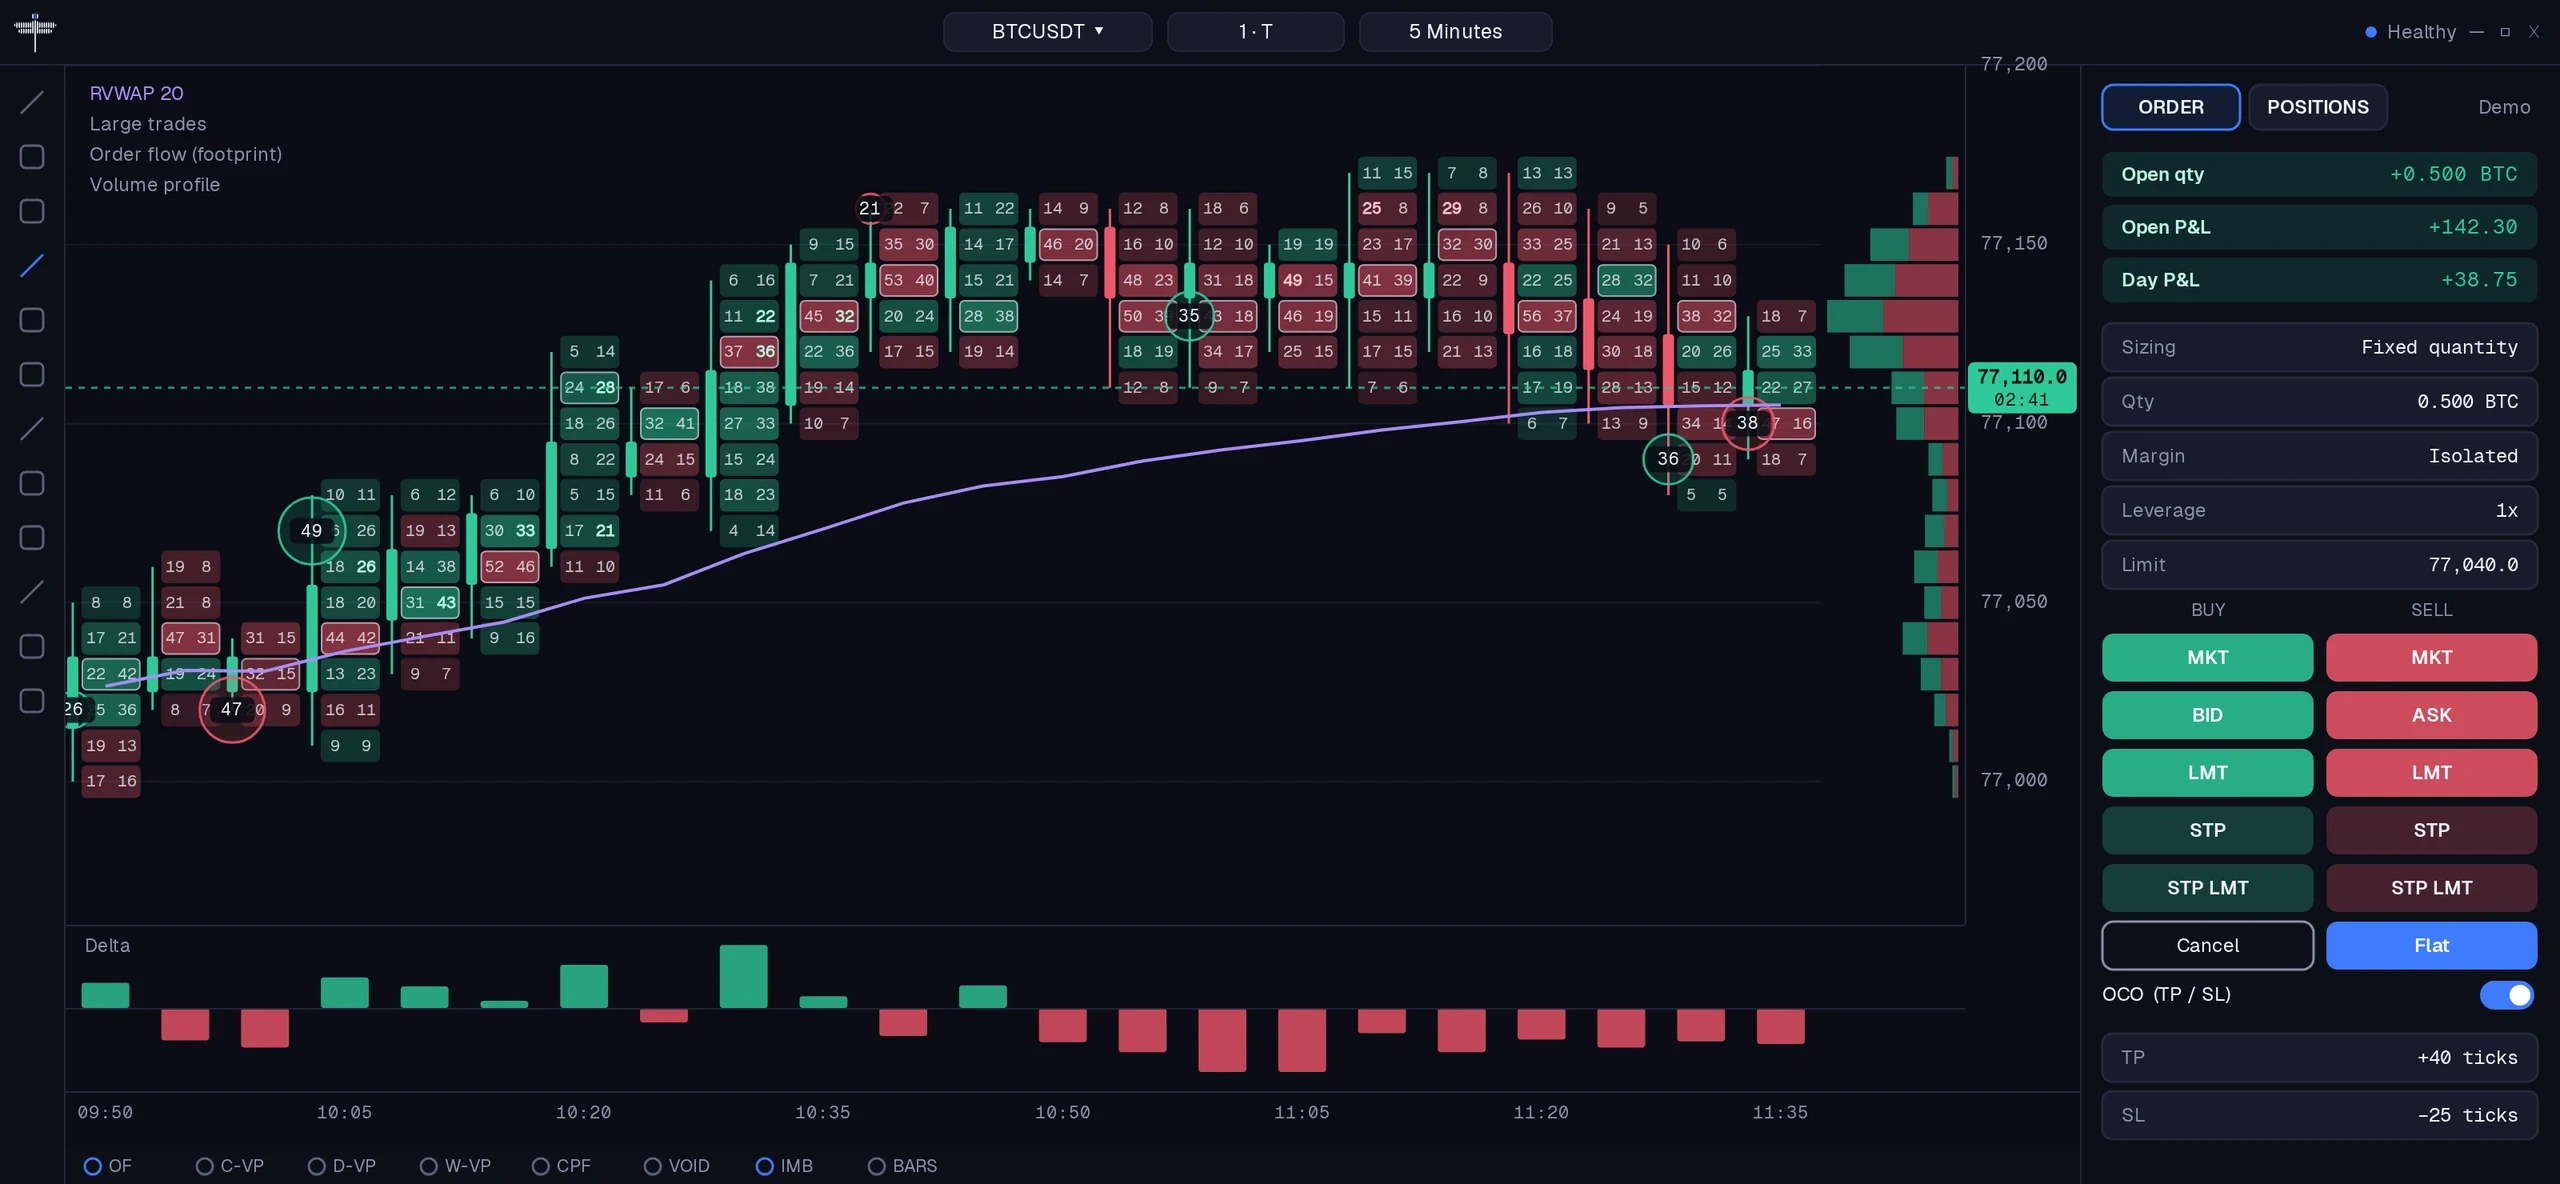
Every trade, the book as it stood, the flow and the derivatives, drawn natively on your GPU, with the order ticket on the same chart.
- 01
The footprint, and the imbalance rule
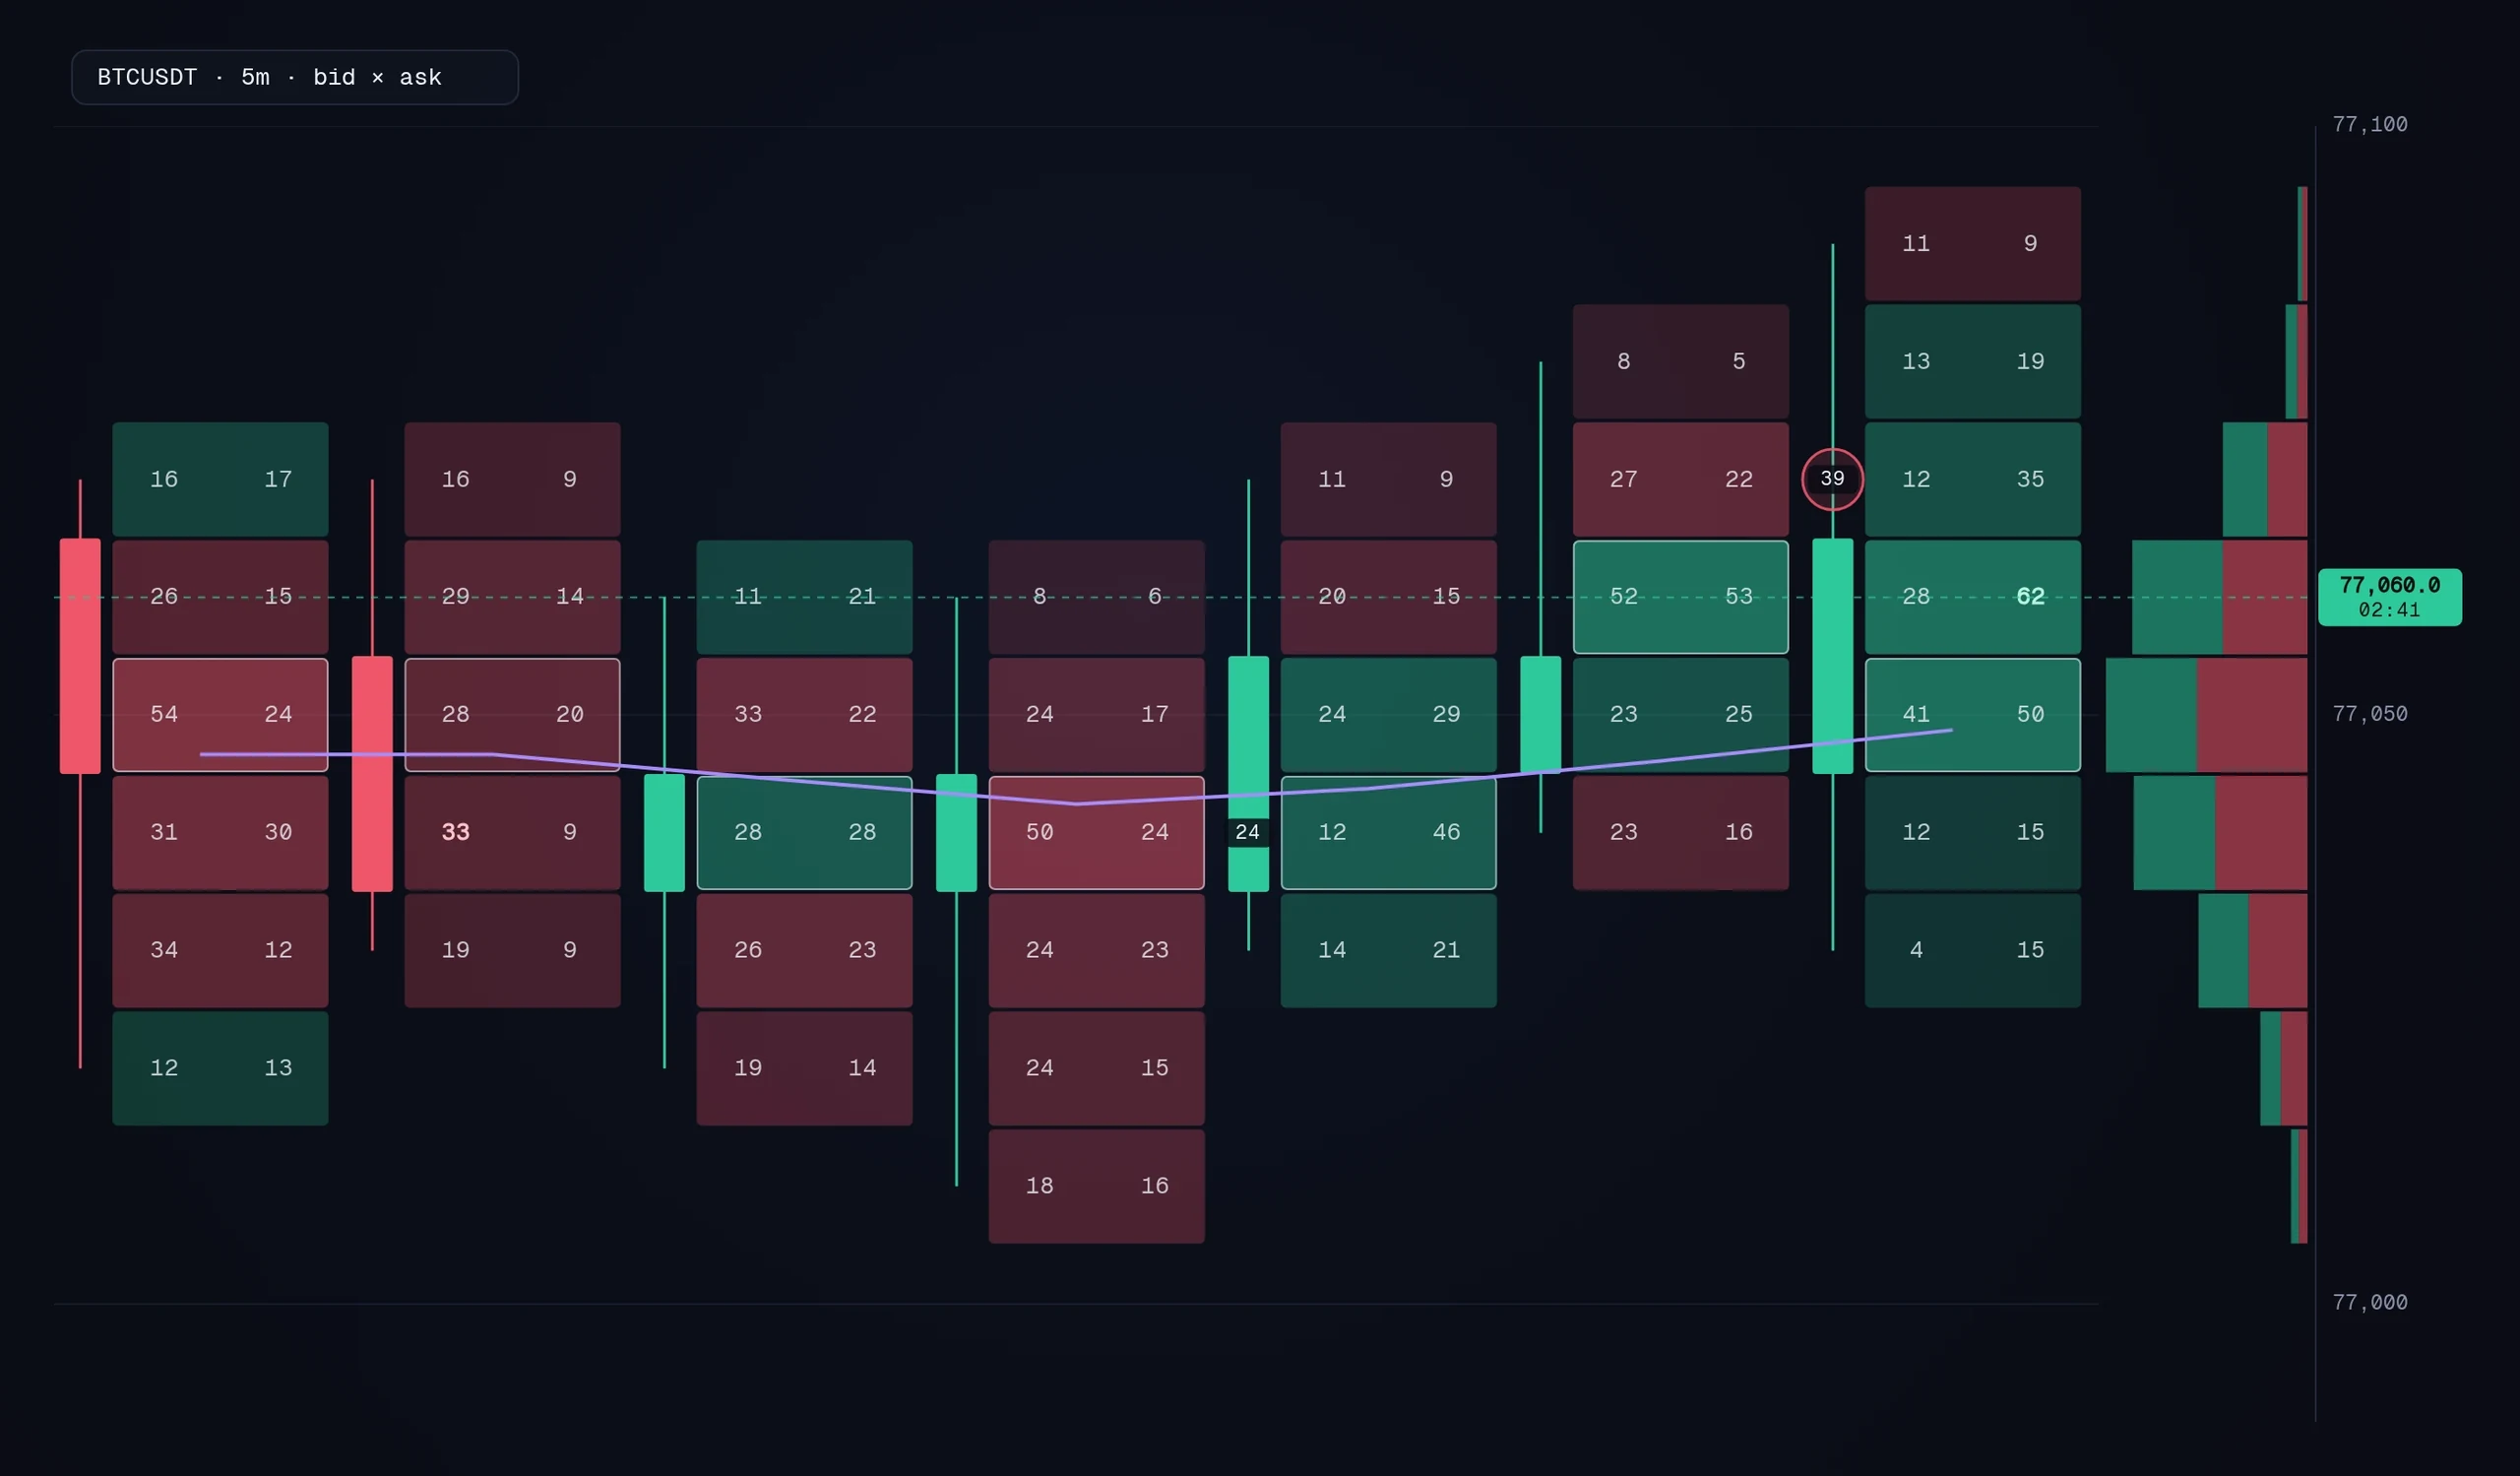
Every bar shows what traded at each price and on which side. Stacked imbalances are marked where the rule you set is met. The rule is a setting because a zero on one side always technically qualifies, and a mark that means nothing is worse than no mark.
- 02
45 panels, one time axis
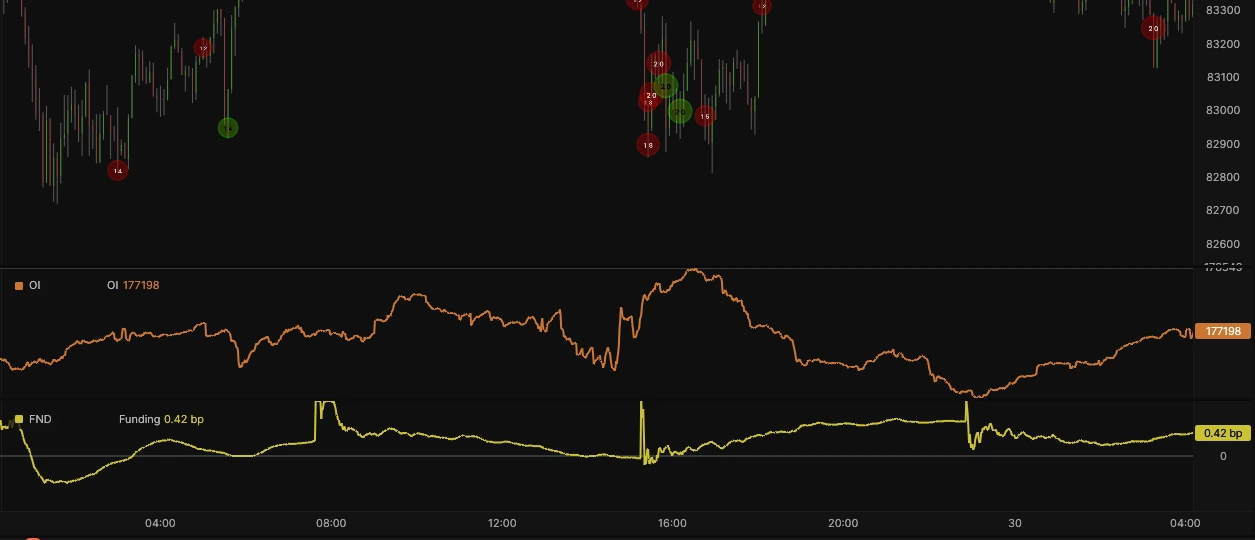
Each analysis panel is a genuinely separate region with its own GPU pass and its own value scale, not a fixed-fraction band stacked inside the price canvas pretending to be one.
- 03
Execution, and the confirmation you can turn off
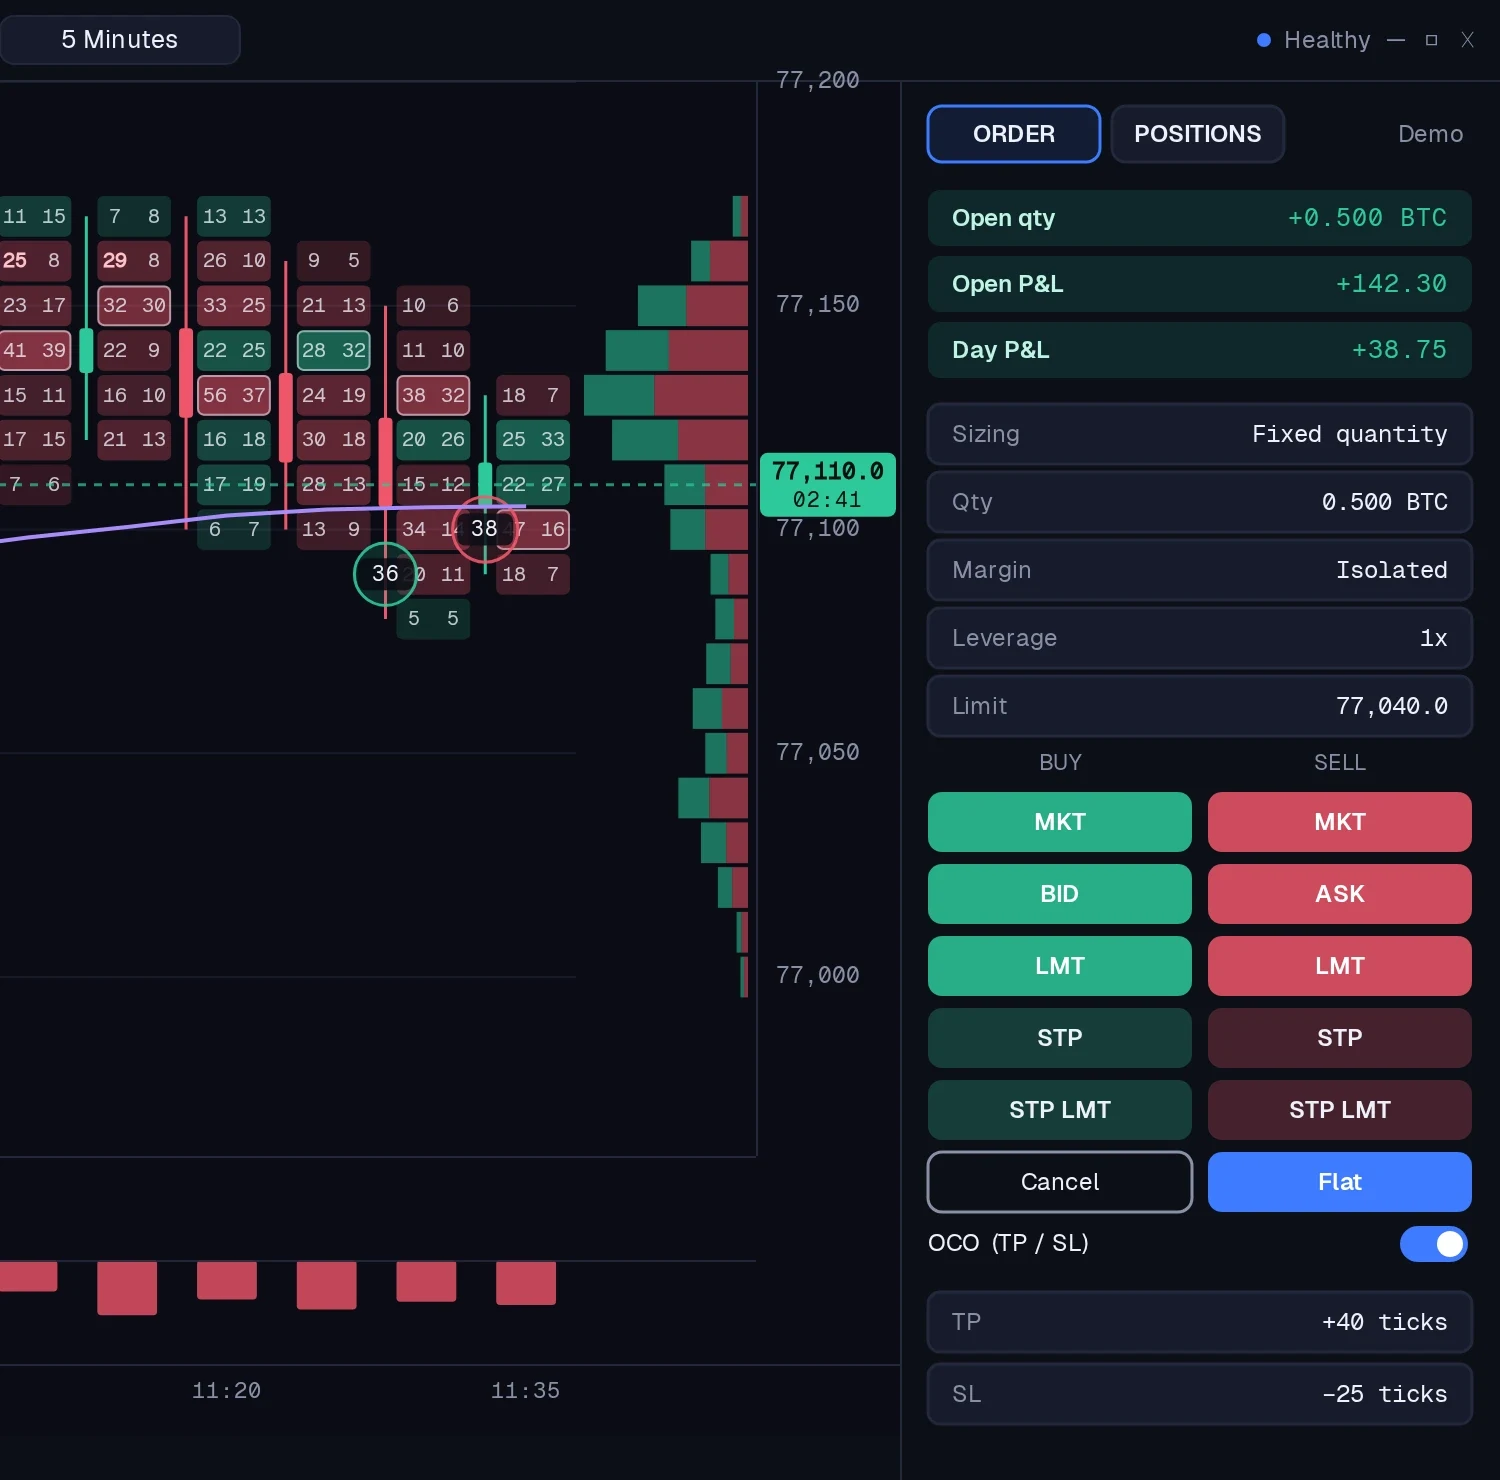
Trading lines on the chart, drag to move a stop, right-click to cancel. Live orders can require a confirmation dialog; cancelling never does, because making "get me out of this" wait on a dialog is its own hazard.
The resting book, over time
The liquidity heatmap draws the book behind price as it actually stood, frame by frame, from captured depth. It is the only layer that asks the backend for depth history, which is why it is off until you ask for it. A chart that arrived with it on would start every session downloading segments nobody wanted.
Where price fell through nothing
Liquidity voids mark the ranges the resting book barely covered. Imbalance zones mark the shelves price walked through. The absorption map shows where aggression was held and where it broke.
Real research, not a backtest that flatters
Write the strategy once in T0, run it across years and dozens of markets with real costs, and keep only what survives.
- 06
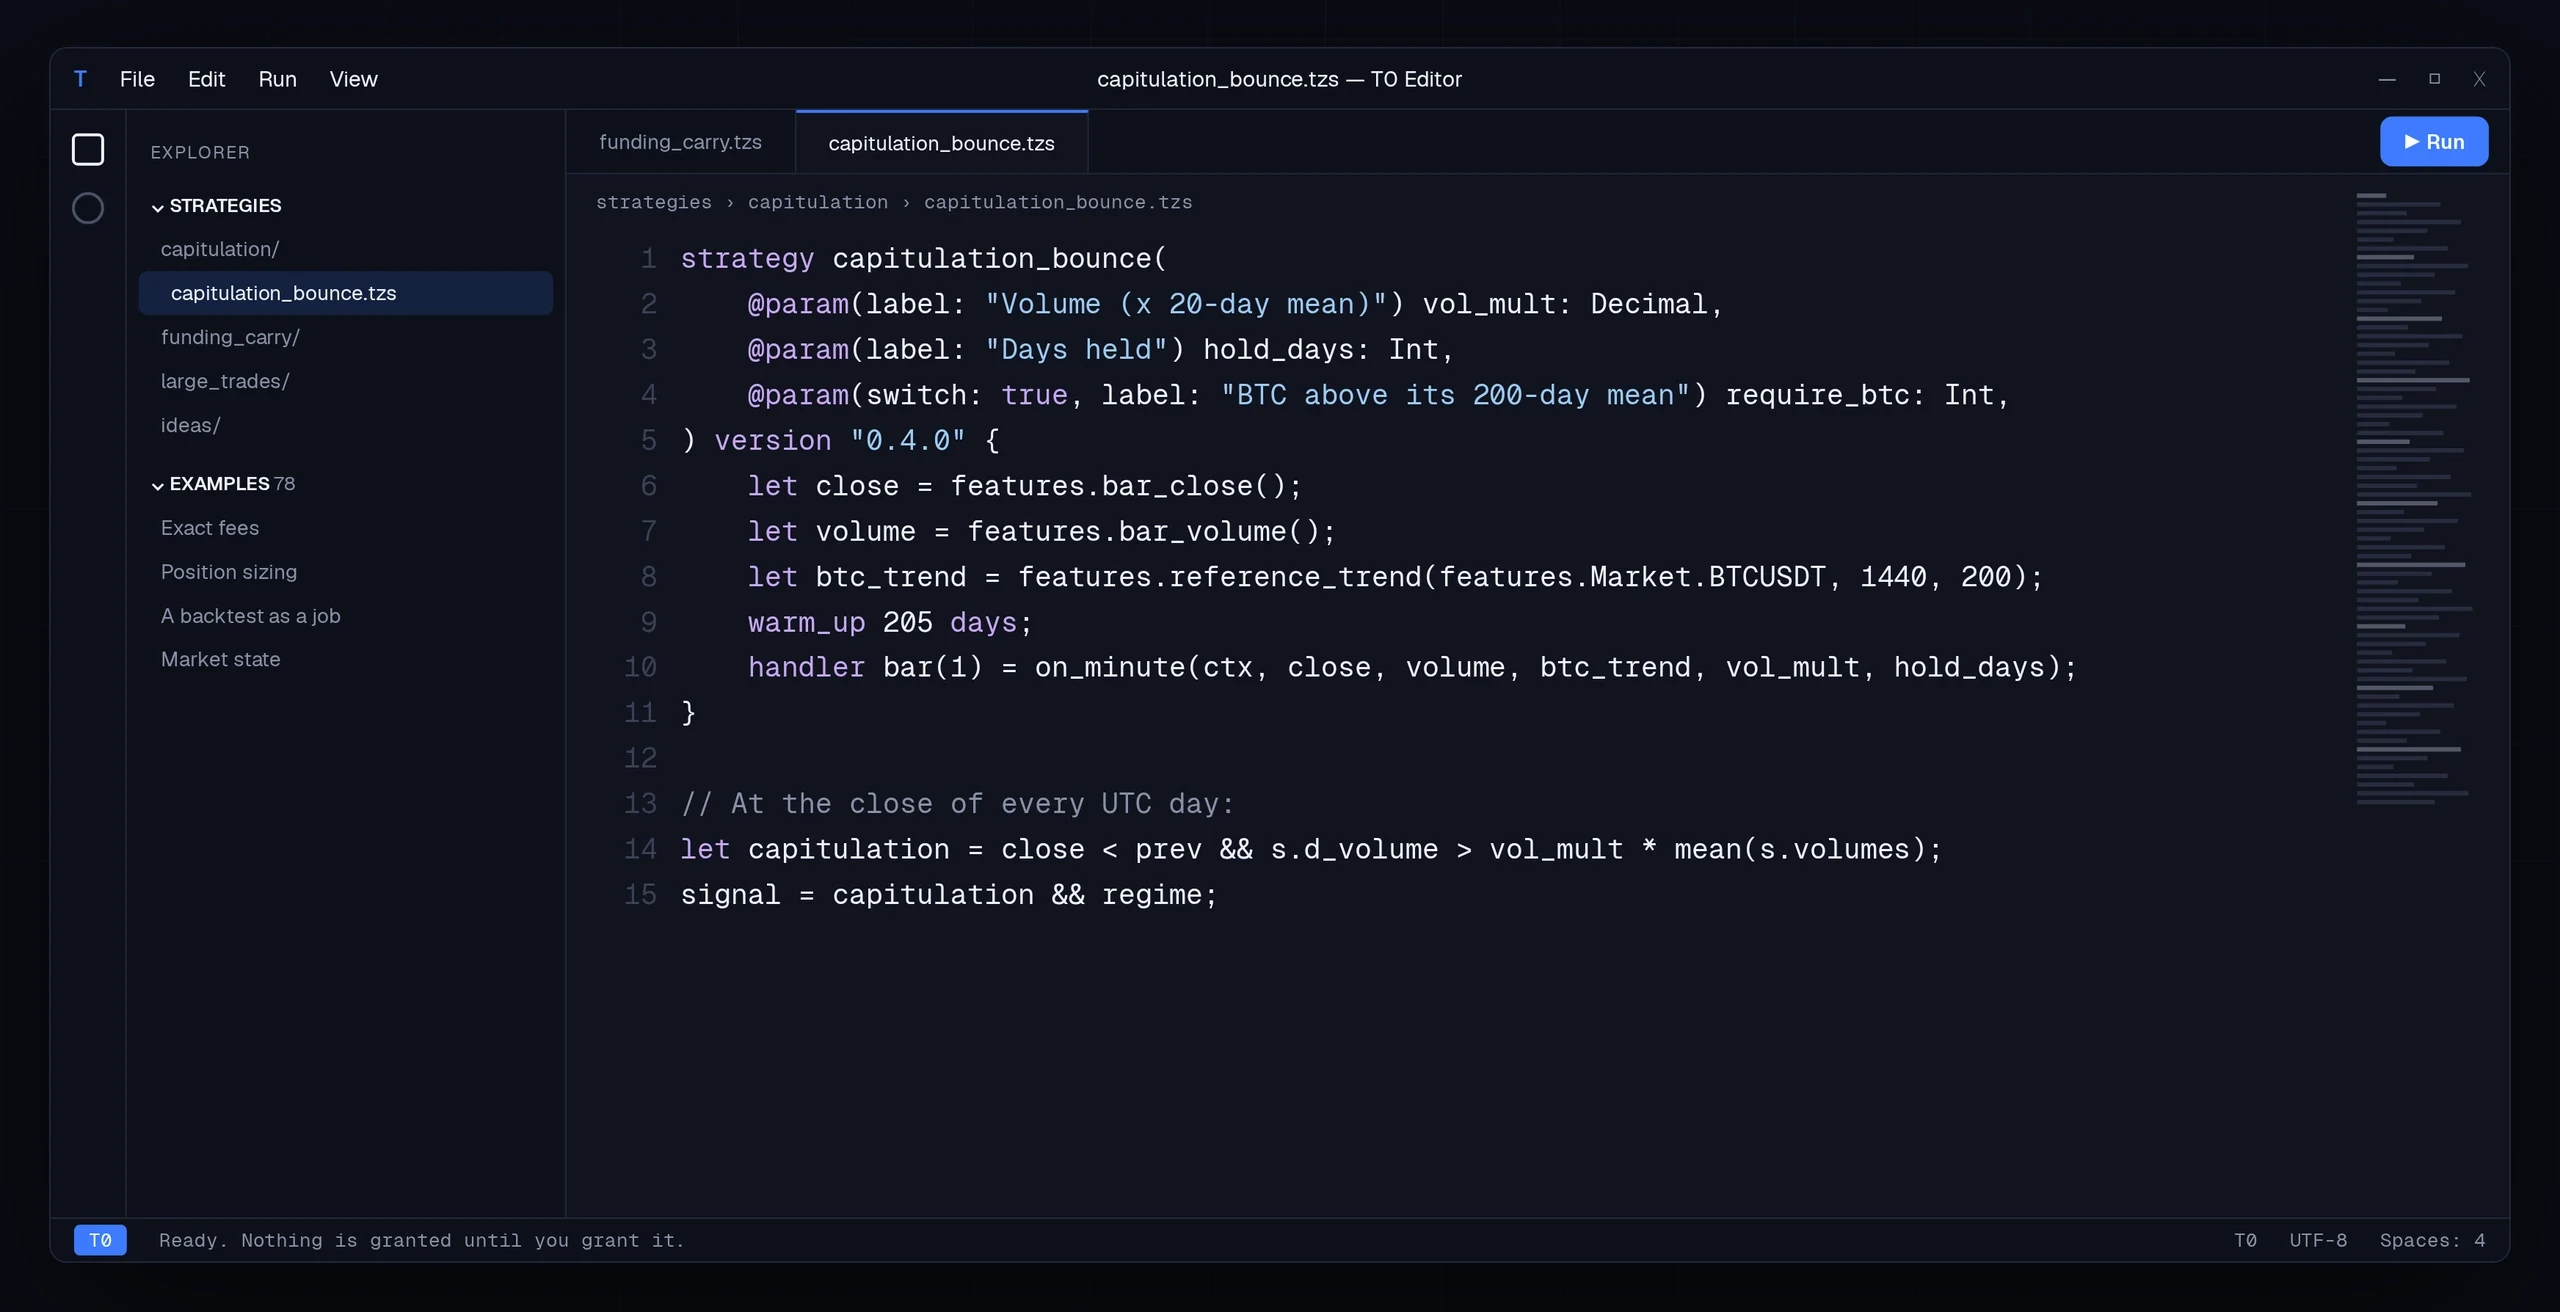
Write it in T0
A strategy is one T0 file: its settings, its warm-up, and the handlers that run on each bar and on each fill. The same file runs in a backtest, in a Study and live, so what you tested is what trades.
- 07
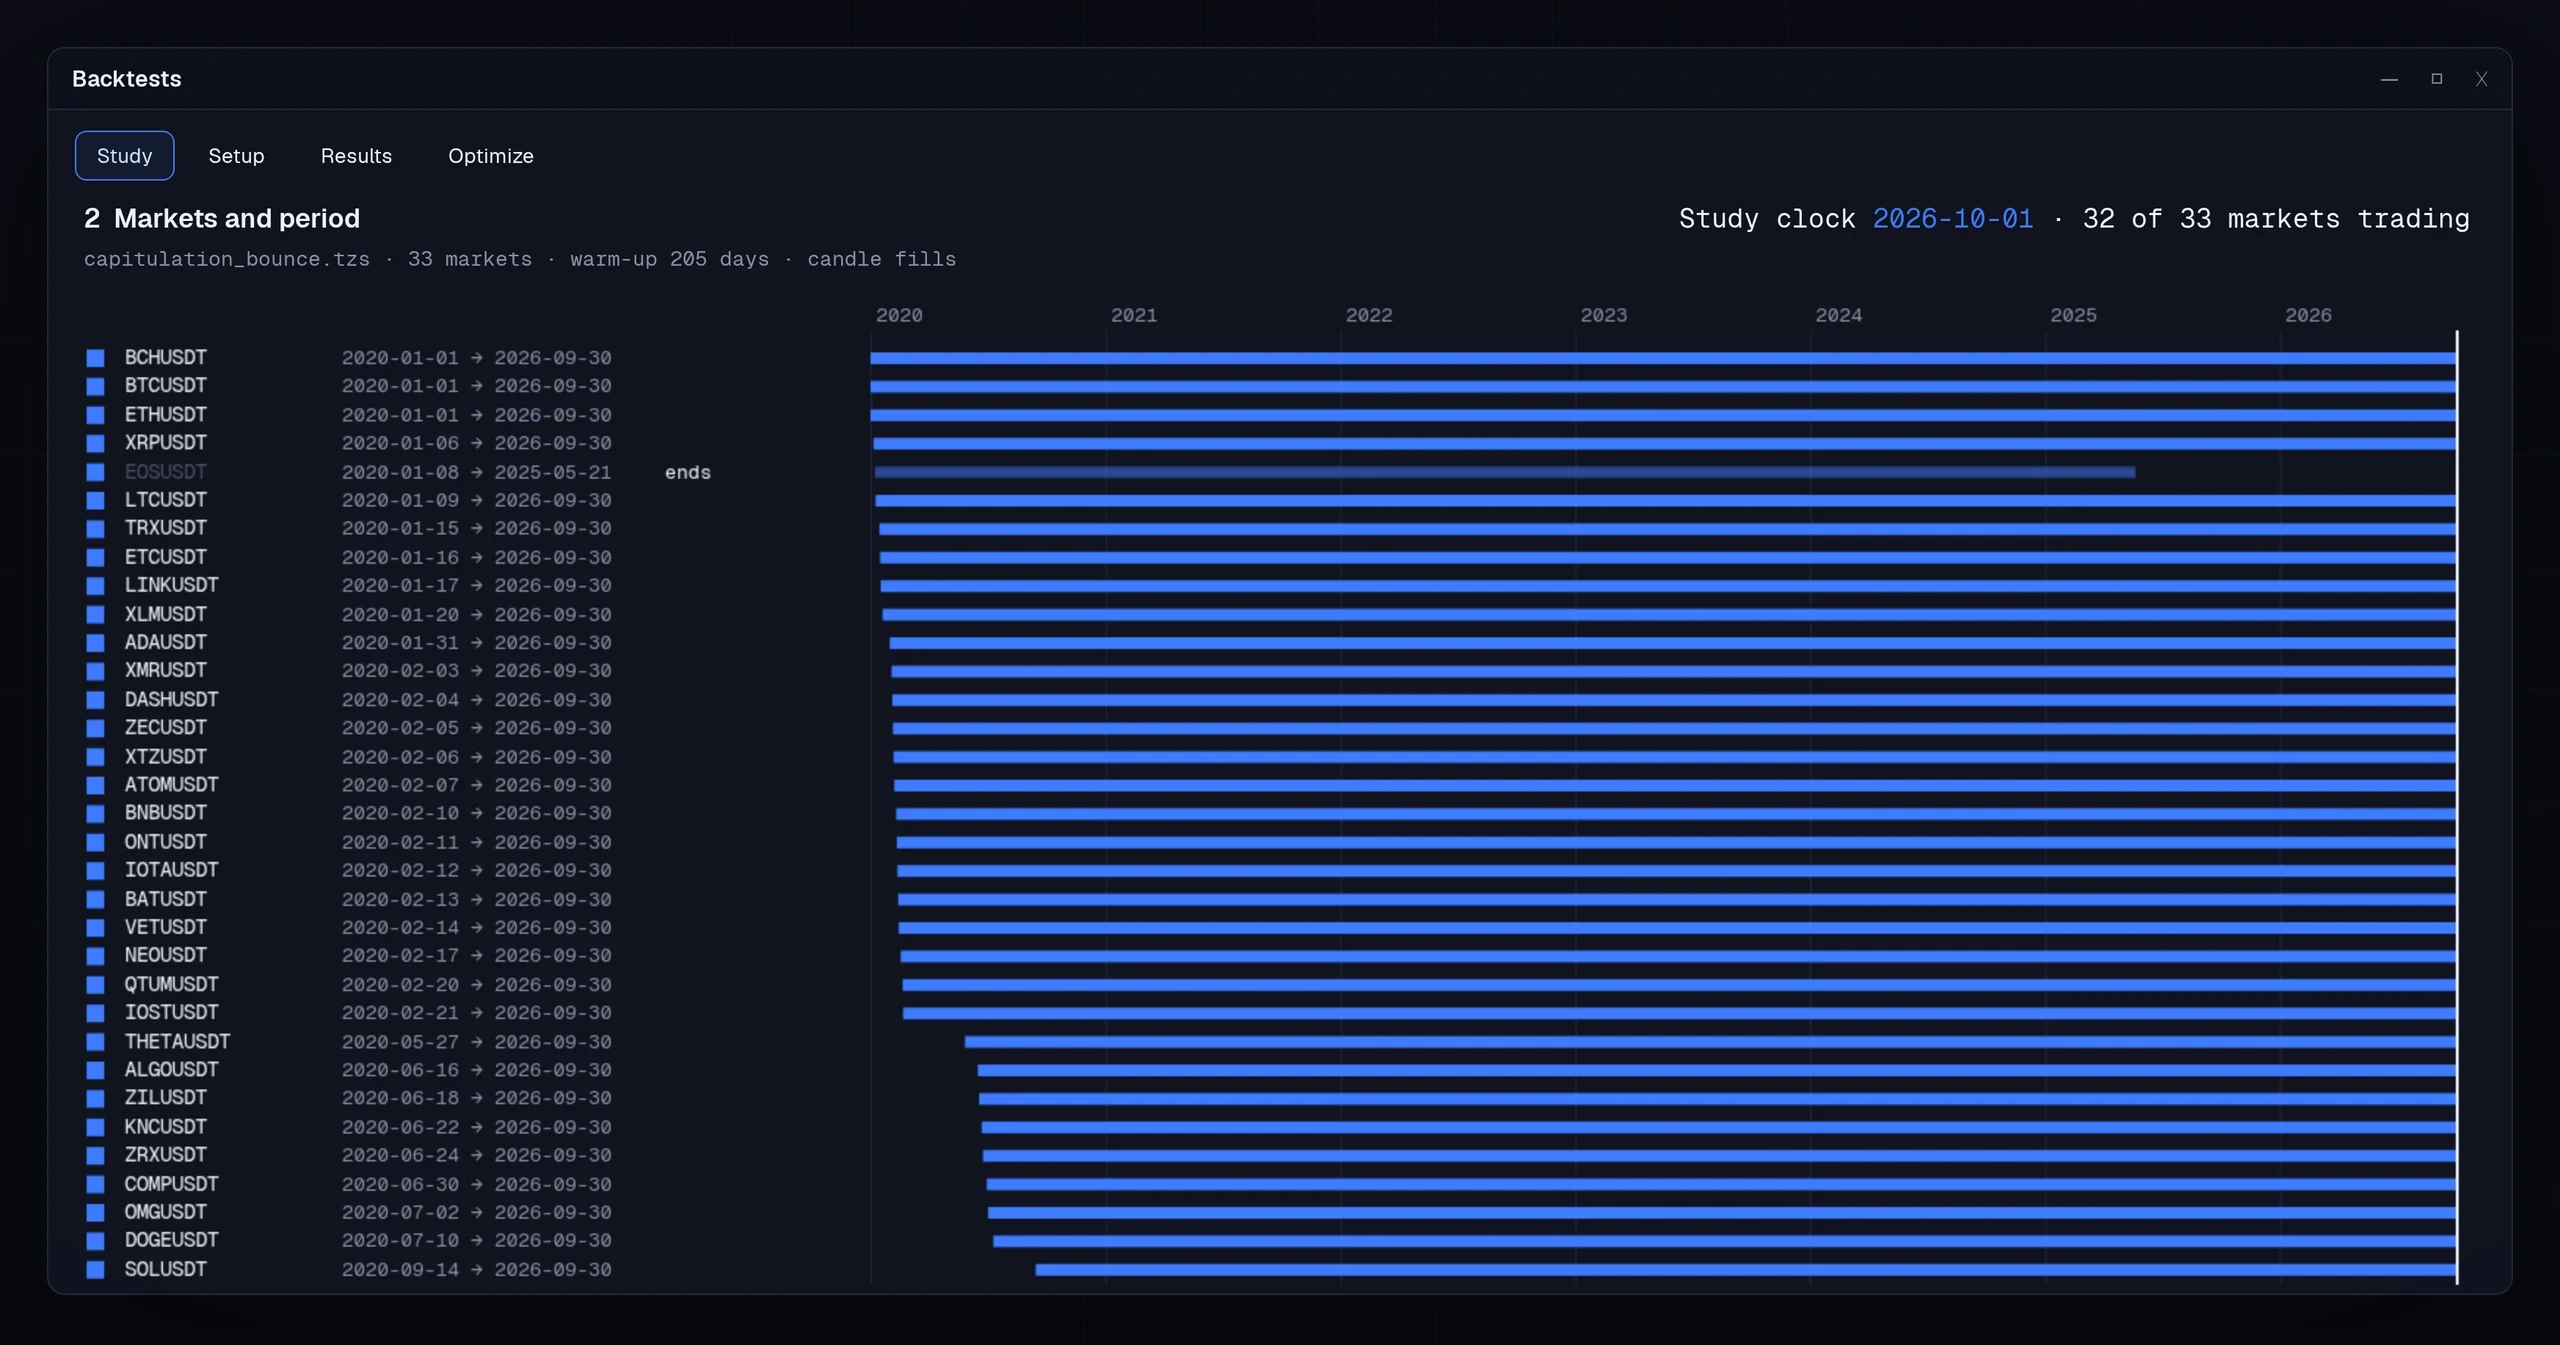
Years of history, dozens of markets, at once
A Study runs one strategy across every market you hold, each on its own account. A market joins on the first day it has data and never holds the others back; its warm-up comes from its own first days.
- 08
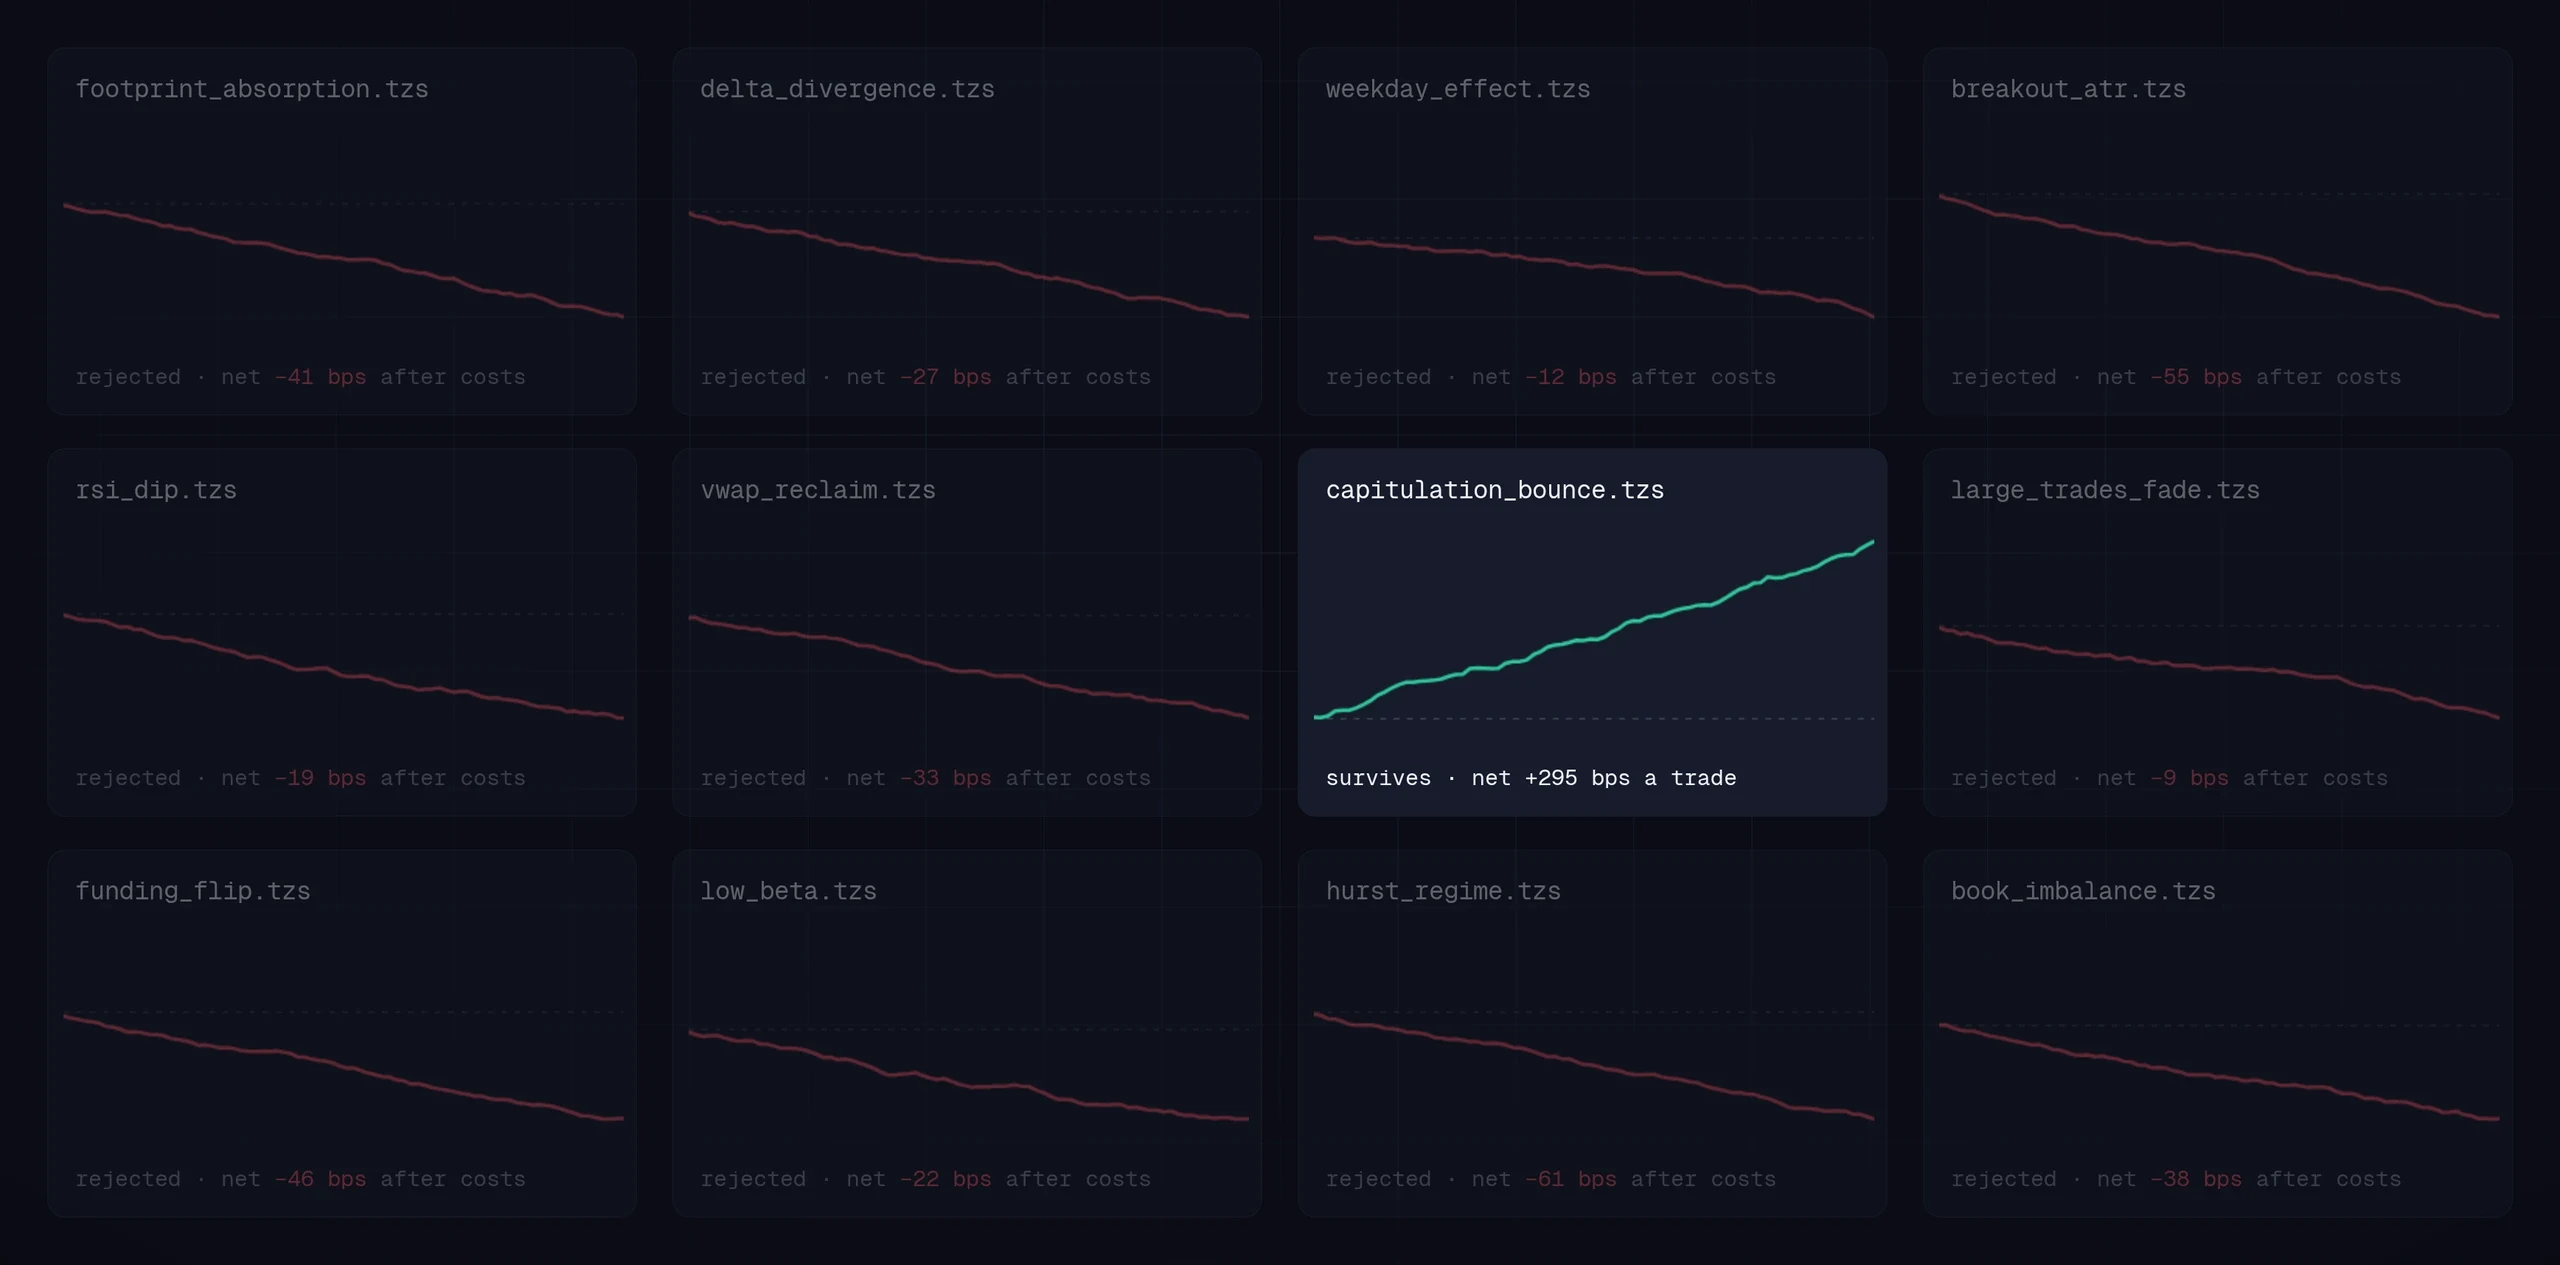
Most ideas won't survive
Every idea is judged after real costs, fees and funding, on the train and valid periods. Test and final stay sealed until you open them, once, on the record. Most ideas fail there, cheaply, before they cost you anything.
- 09
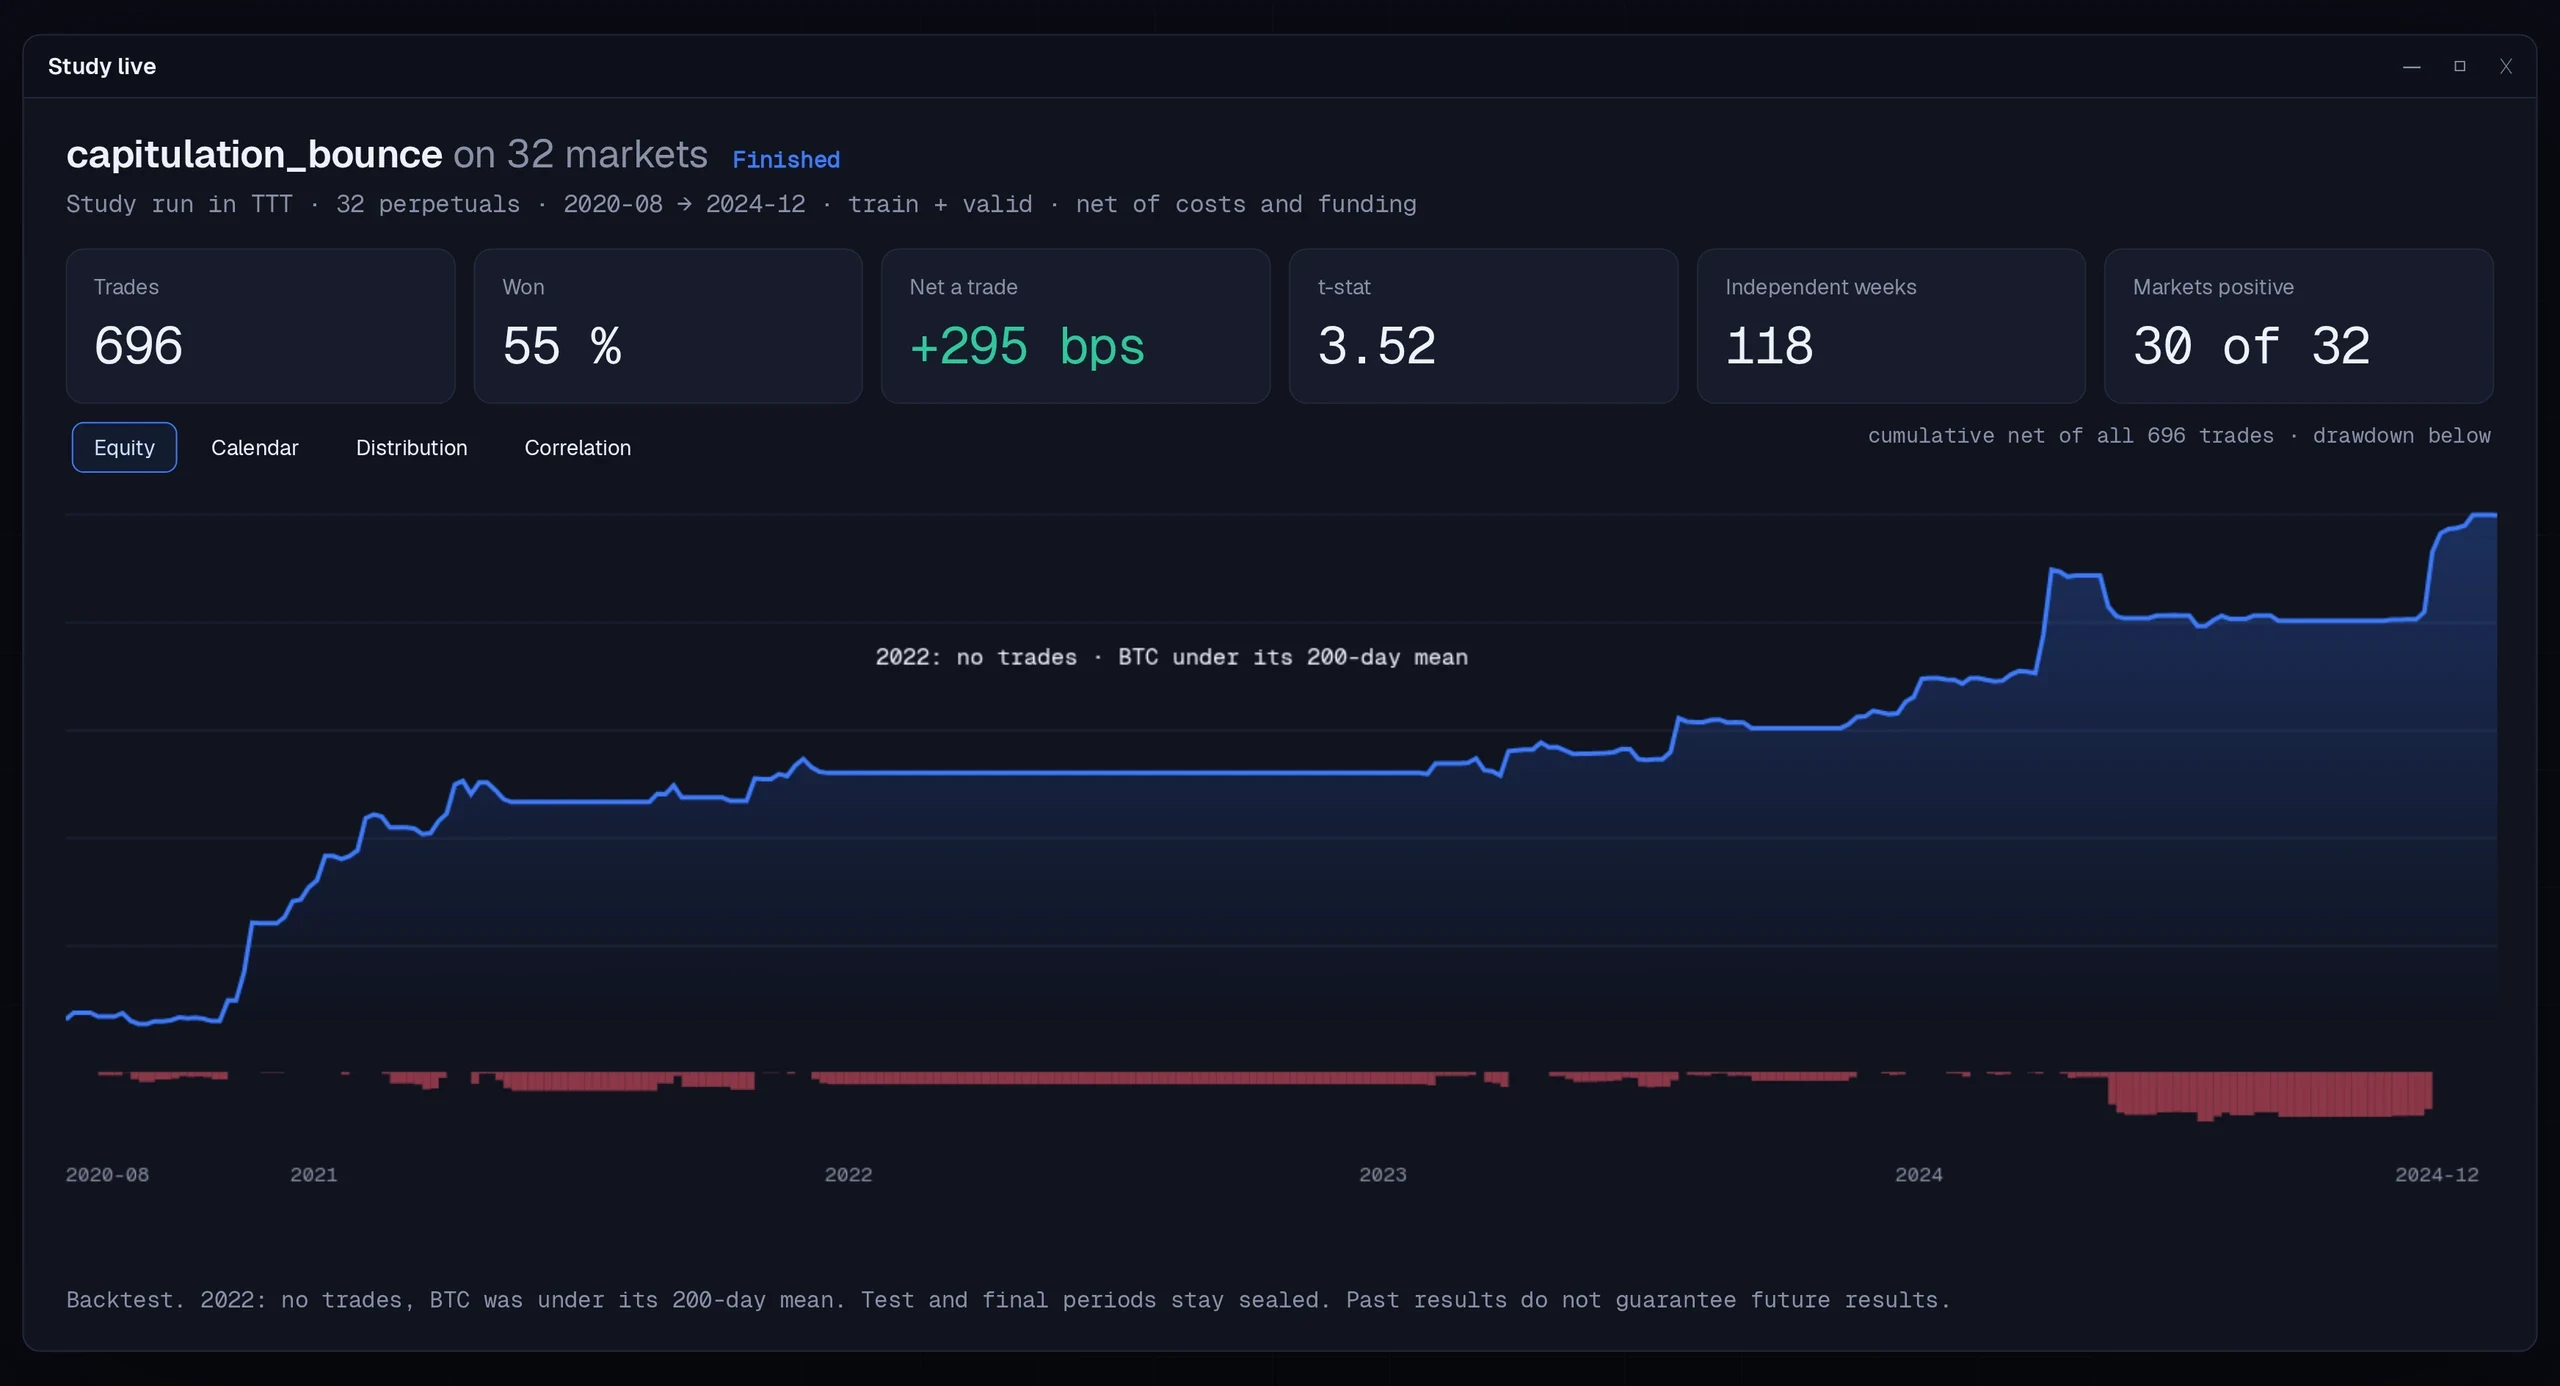
What survives, with its numbers
Trades, win rate, net result per trade, t-statistic, independent weeks, markets positive, the curve and its drawdown, year by year. The figures say what the strategy did, including the years it sat out.
The same code, on the server
Send what survived to the server, keep its risk limits, and see every strategy on one desk the next morning.
- 10
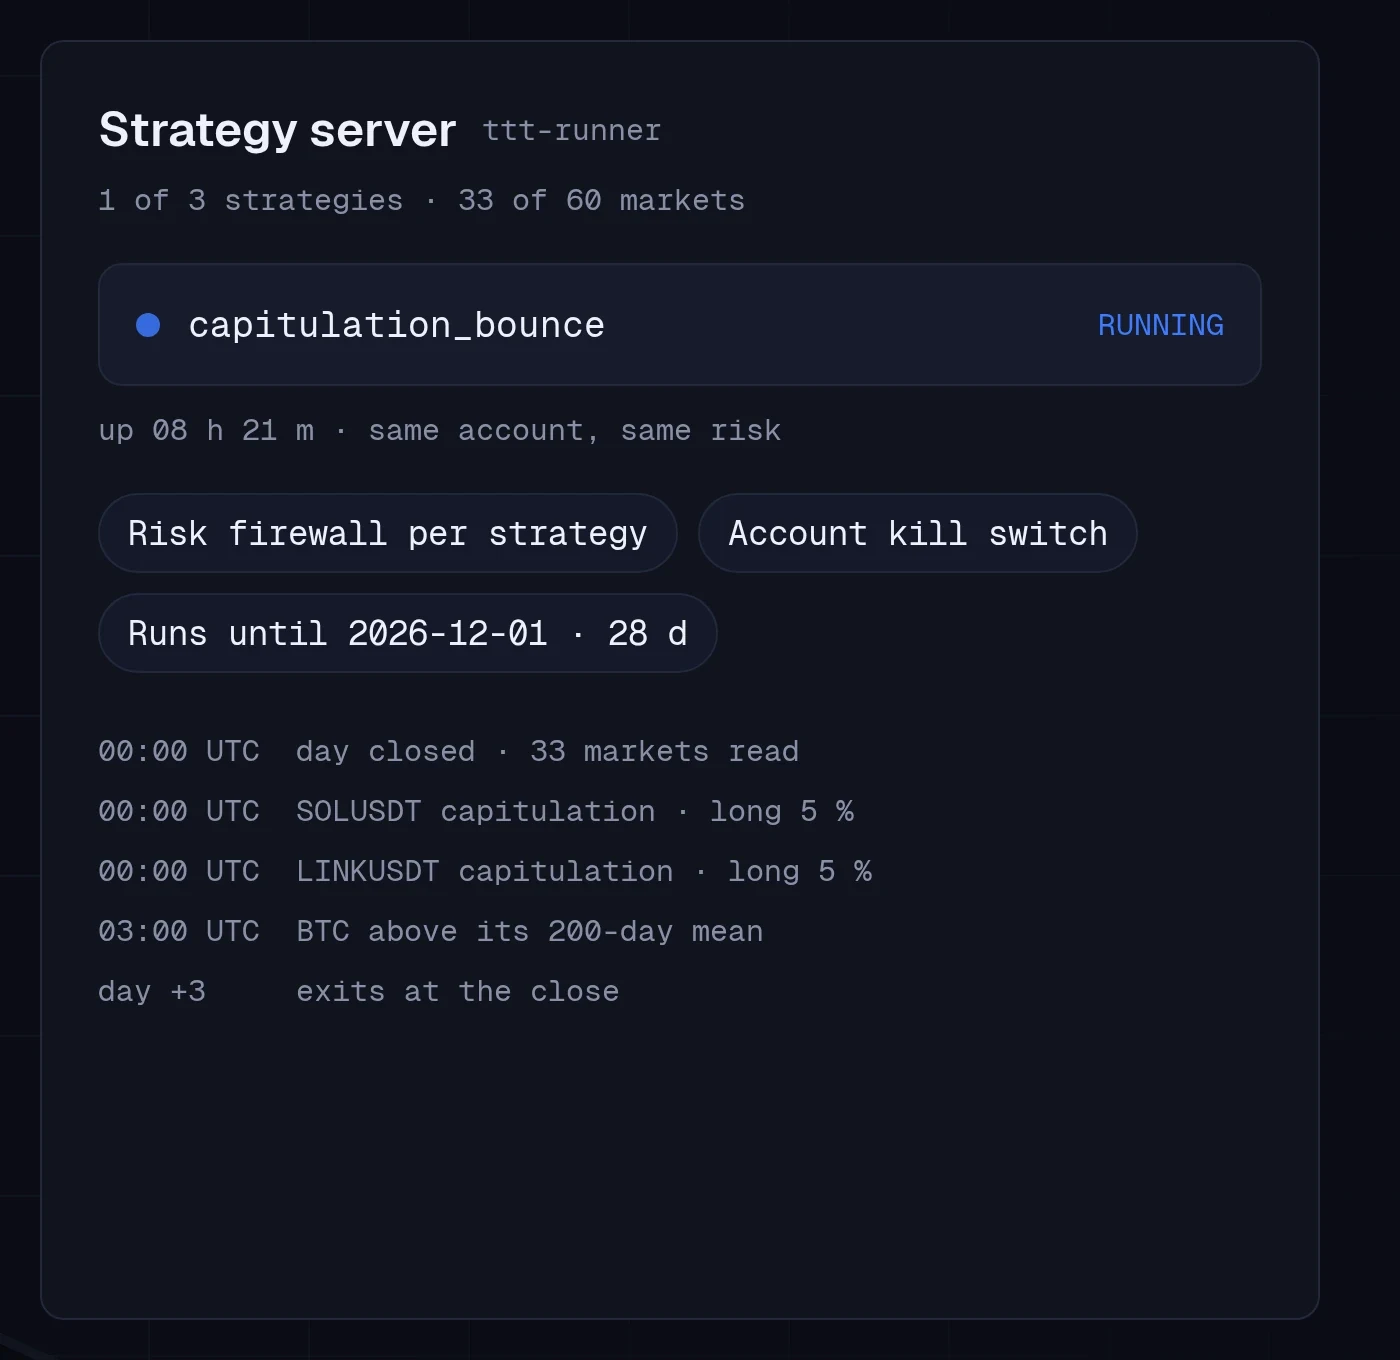
The strategy server
Send a strategy to the server and close the laptop. Each one runs with its own risk firewall, an account-wide kill switch and the date it runs until in view; if the server restarts, the run is replayed from its start. Demo and testnet accounts today.
- 11
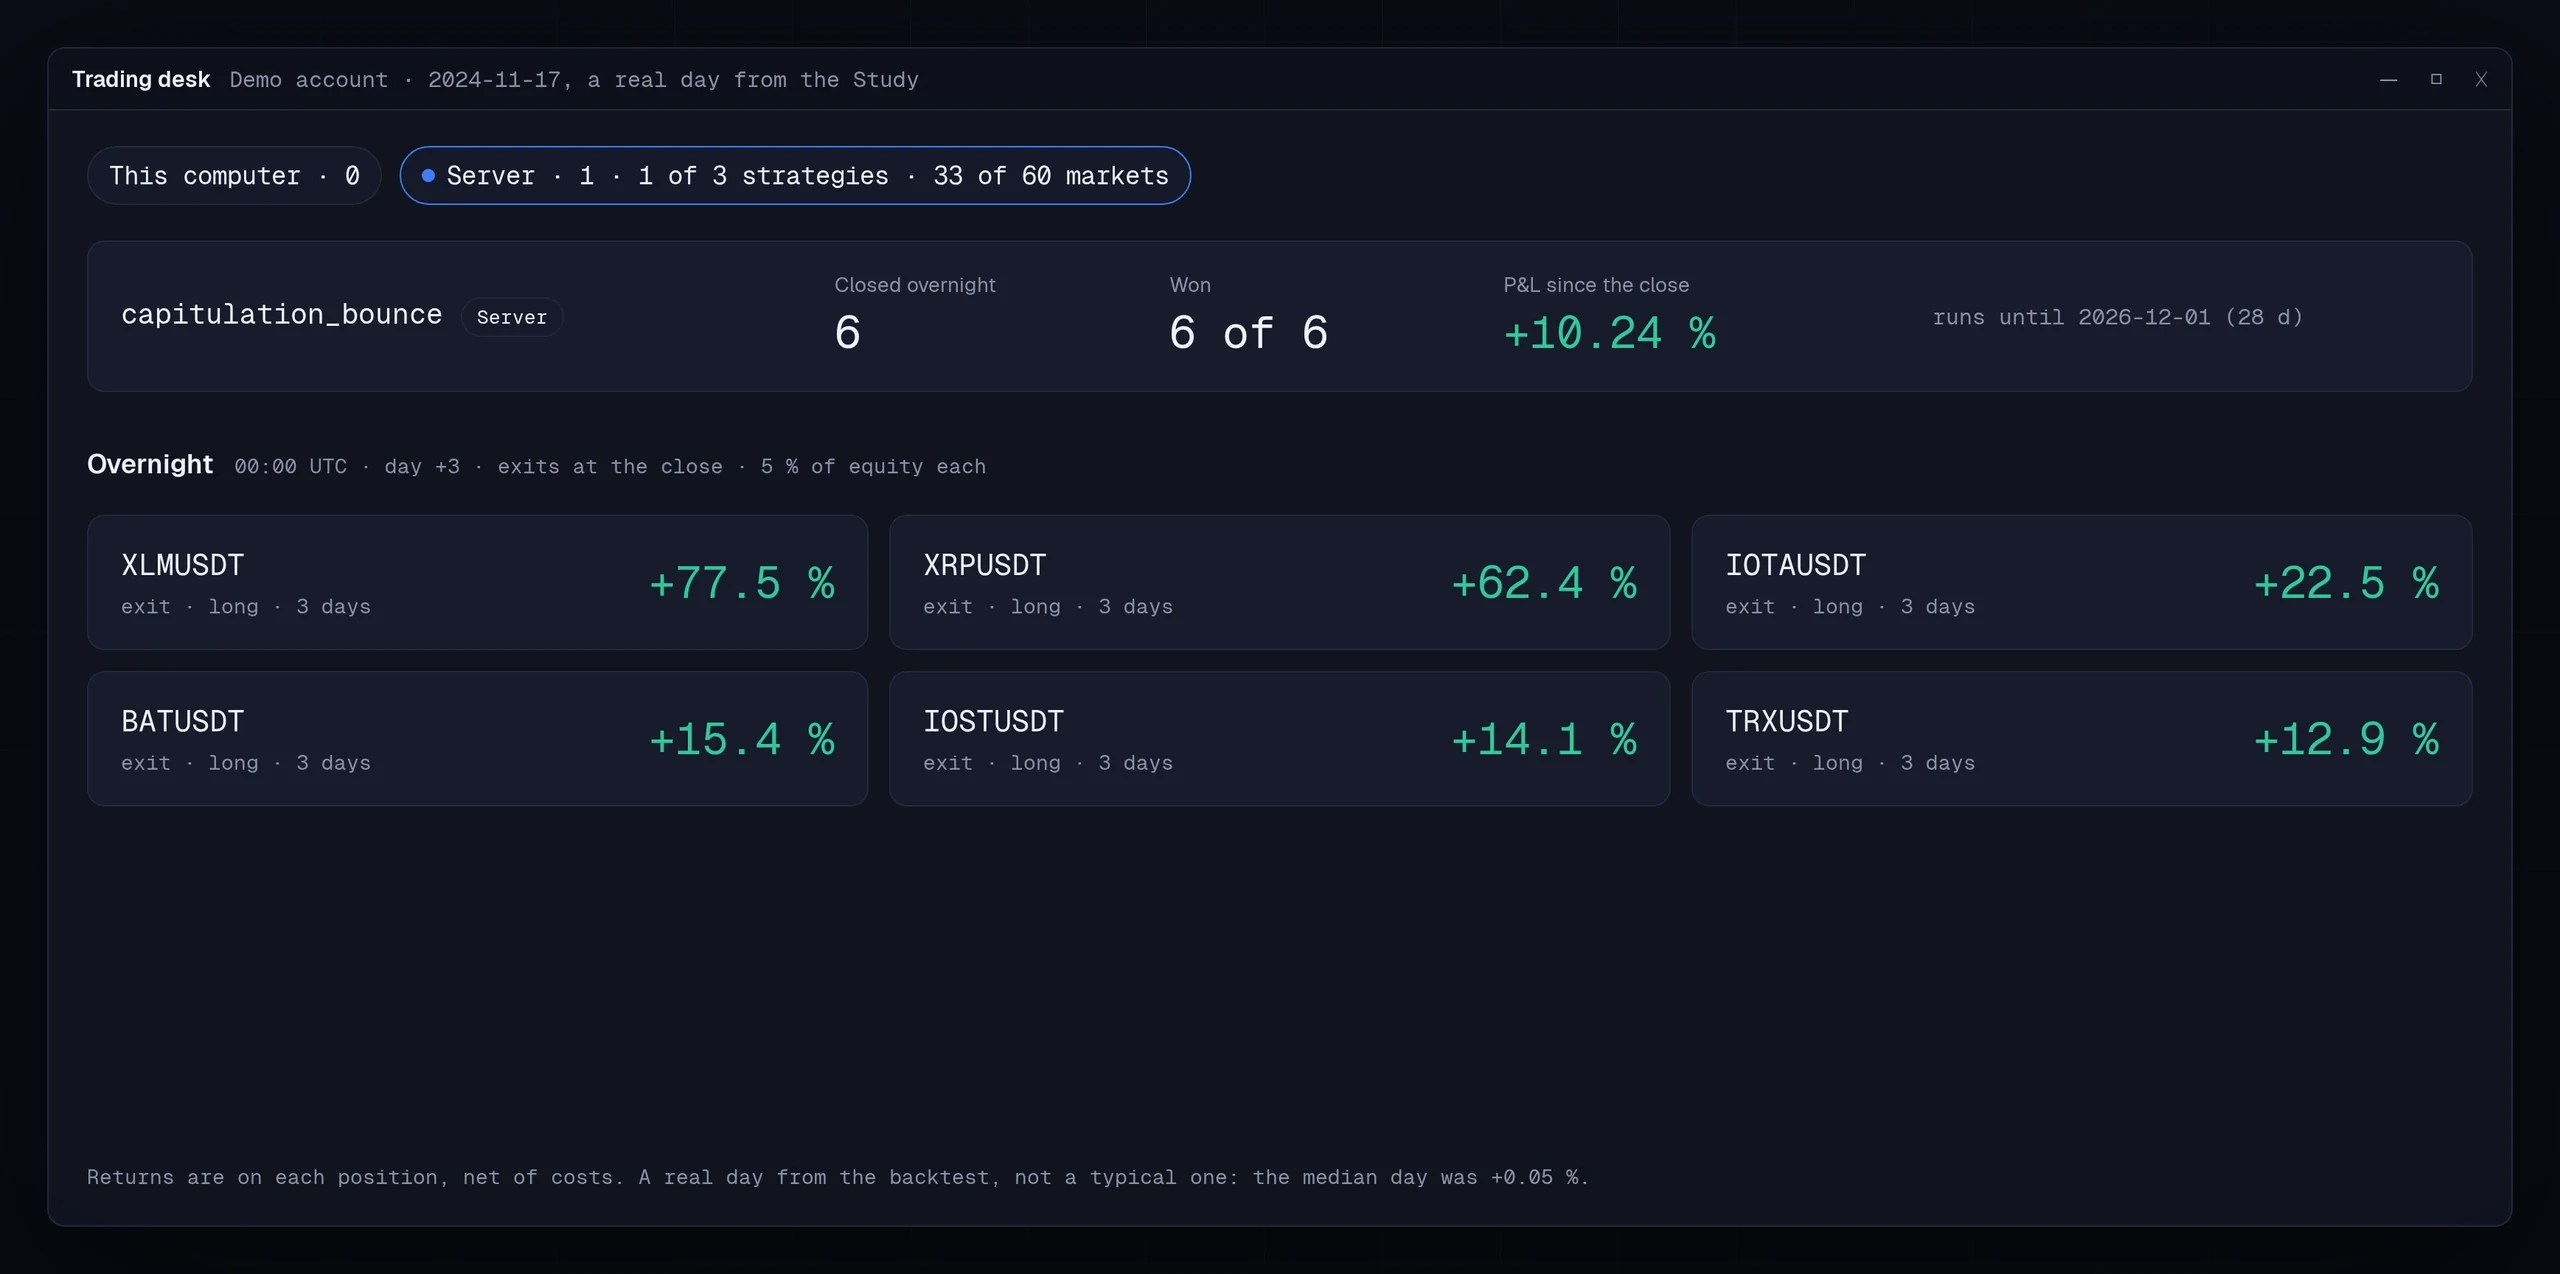
The trading desk
Every strategy on one board, the ones on this computer and the ones on the server: positions, overnight fills and the account's result, with the same metrics and the same risk scope.
- 12
Your workspace, saved and synced
Layouts, charts, templates and window geometry persist, and sync to your account so a second machine opens where the first left off. They stay reachable even without a current licence: your saved work is yours.