What TTT can do
A native desktop terminal for crypto order flow, drawn on the GPU, built on market data we capture ourselves.
Order-flow scripting
T0 Lang is a scripting language for the whole terminal, not just the chart. A script reads everything TTT shows, live and across its whole history, and it can watch the market continuously instead of answering once.
- Footprint cells, book and heatmap history, tape, big trades
- Liquidations, open interest, funding, options gamma by strike
- Spot against perpetual, venue by venue
- Monitors that run continuously
- Reacts to fills, symbol changes, alerts and the session clock
- Opens, arranges and drives charts and the workspace
- Permissions: a script declares what it needs, you grant it
Backtesting you can prove
The same script runs live, in replay and in a backtest, and it cannot look into the future by construction, so what a backtest shows is what would have happened. Runs are deterministic: run one again and you get the same journal, byte for byte.
- No repaint, by construction
- Fills simulated on real traded prints, with fees and slippage
- A verifiable result card: period, costs and a hash anyone can reproduce
- The same strategy runs on the demo account with its journal
- Data contract: spot, perpetual and options never mixed; gaps never filled in
- 03
Footprint
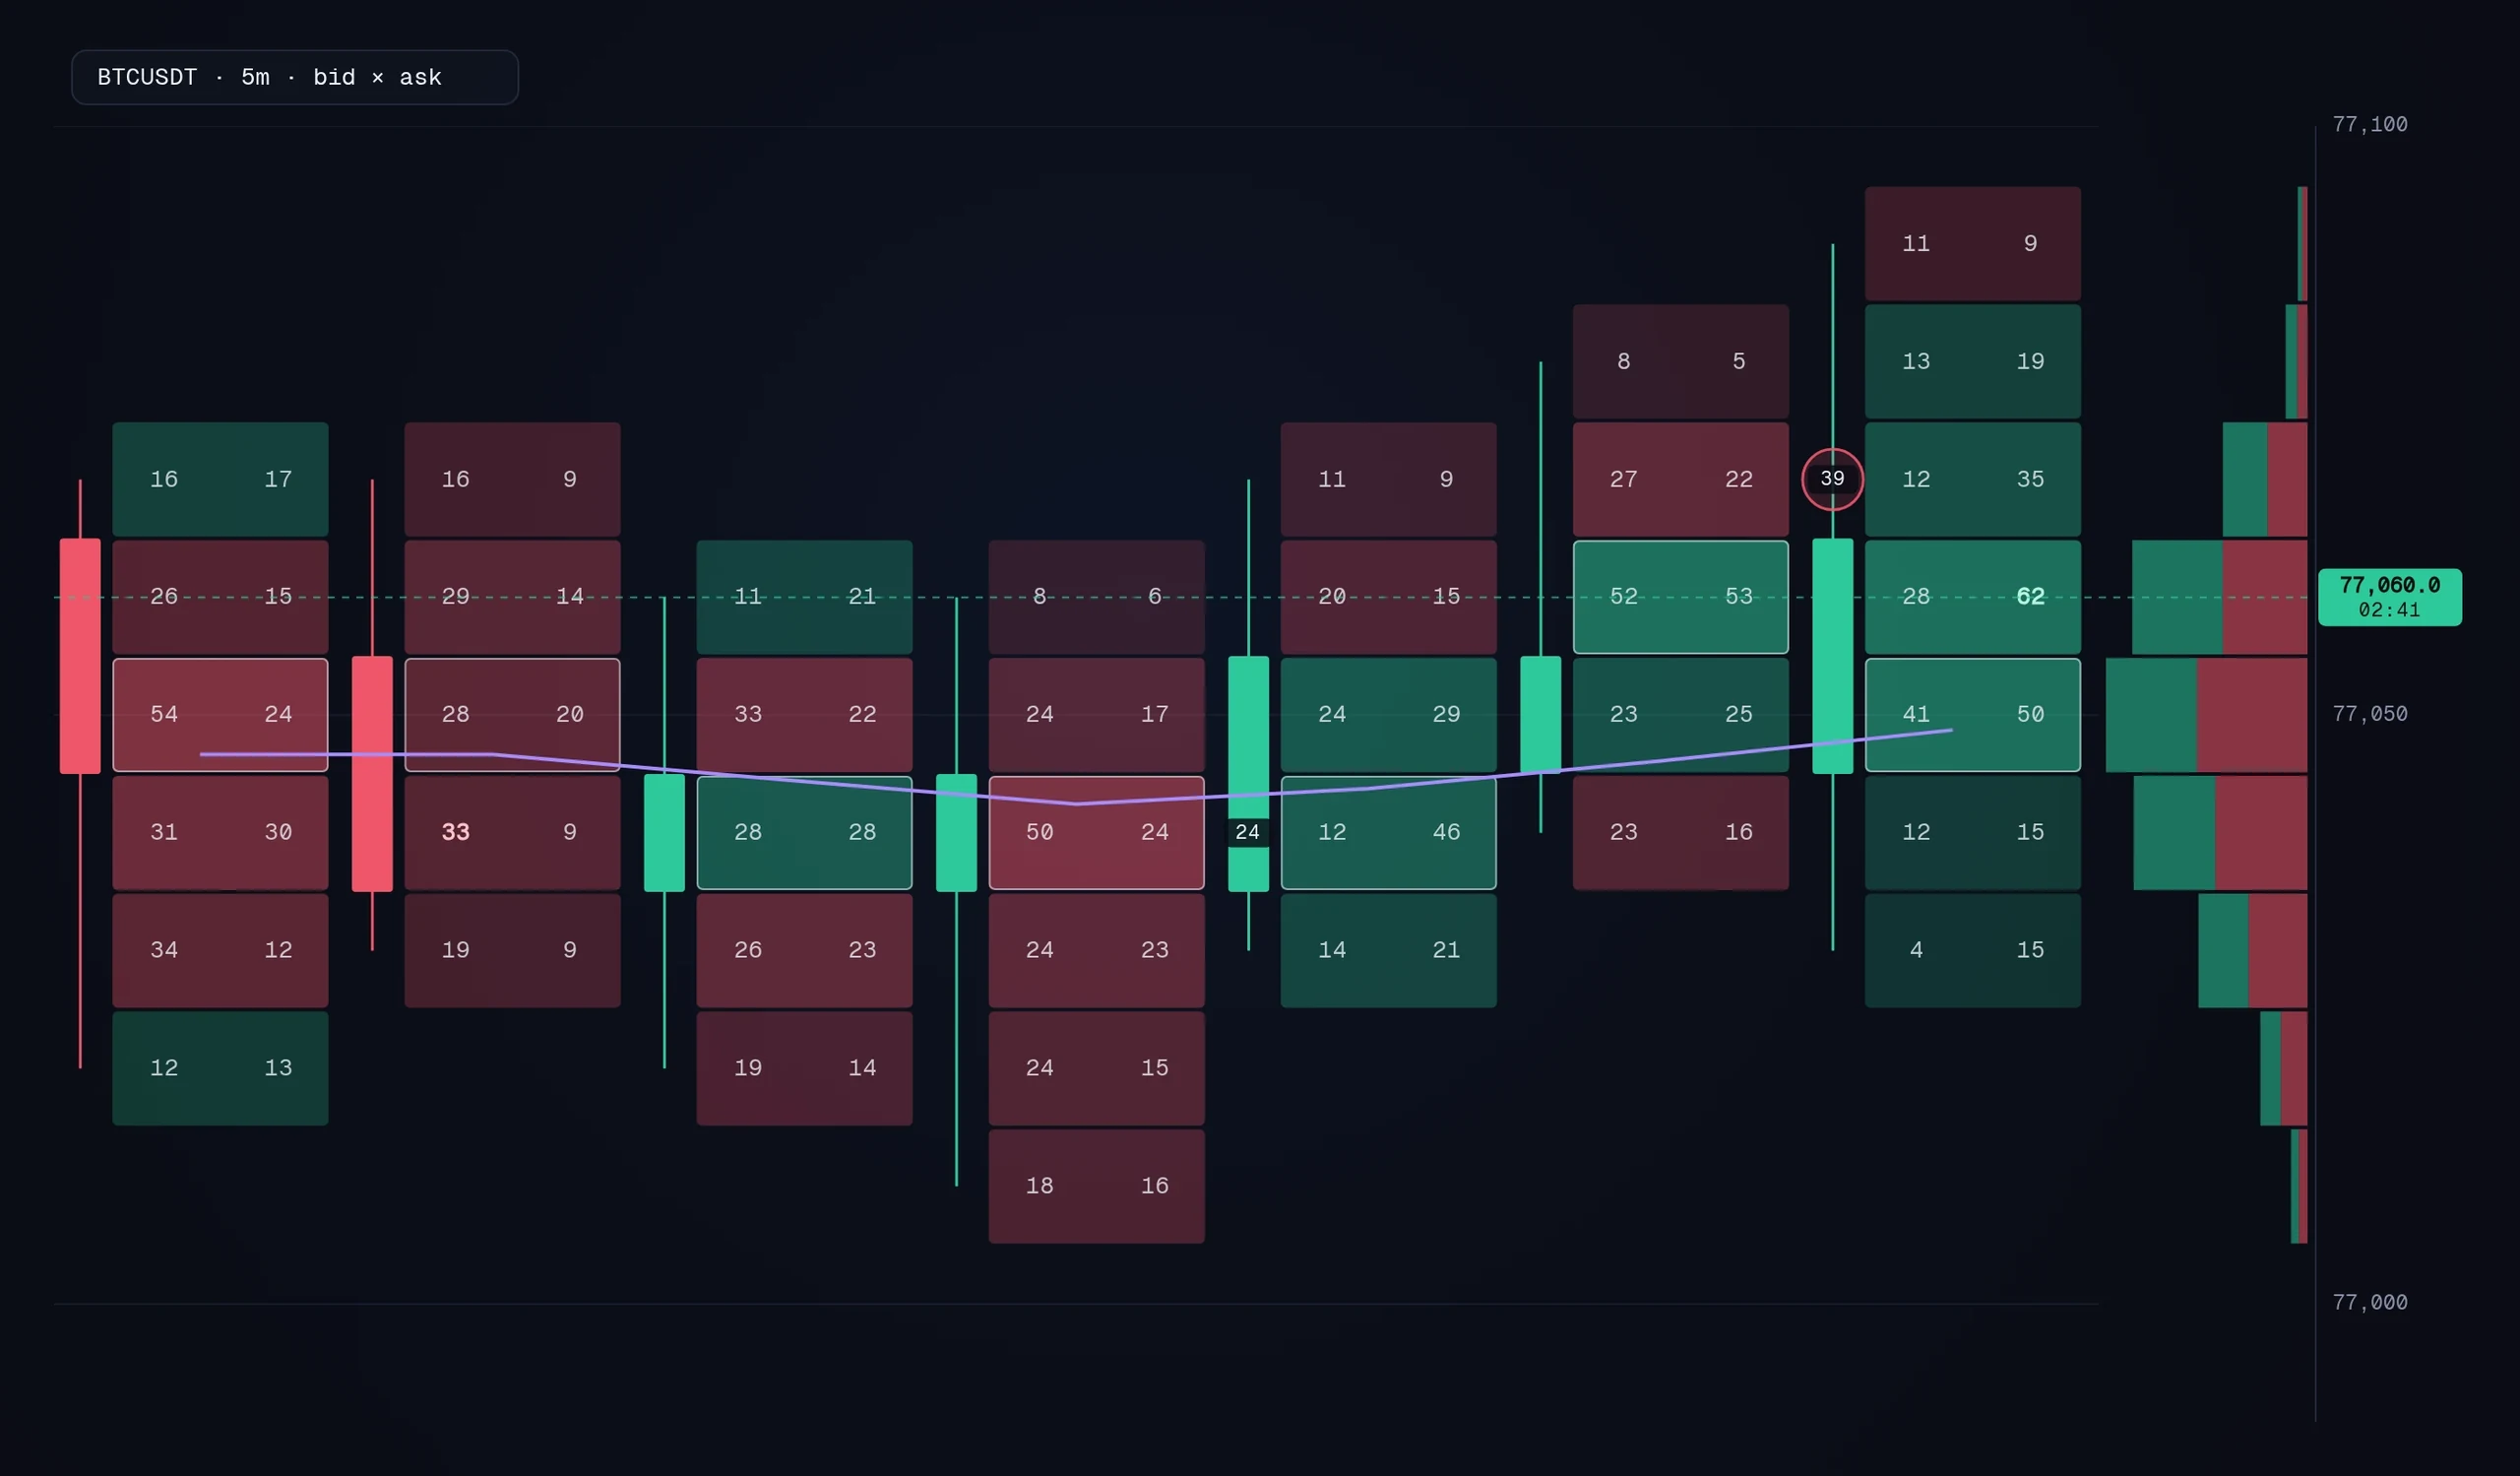
Volume at every price, split into what buyers and sellers did, for every bar, with imbalances and delta. Built from the captured trades, so it is the market's own record, not an approximation from candles.
- Bid and ask volume per price
- Delta and cumulative delta
- Imbalance zones
- Volume profiles and big-trade detection
- 04
Liquidity with memory
A heatmap of resting orders you can scroll back through, plus a depth ladder and tape. Where the book had a hole, or a wall that vanished, is still there to look at afterwards.
- Liquidity heatmap with history
- Depth ladder and tape
- Voids and imbalance in the book
- 05
Derivatives, in the same window
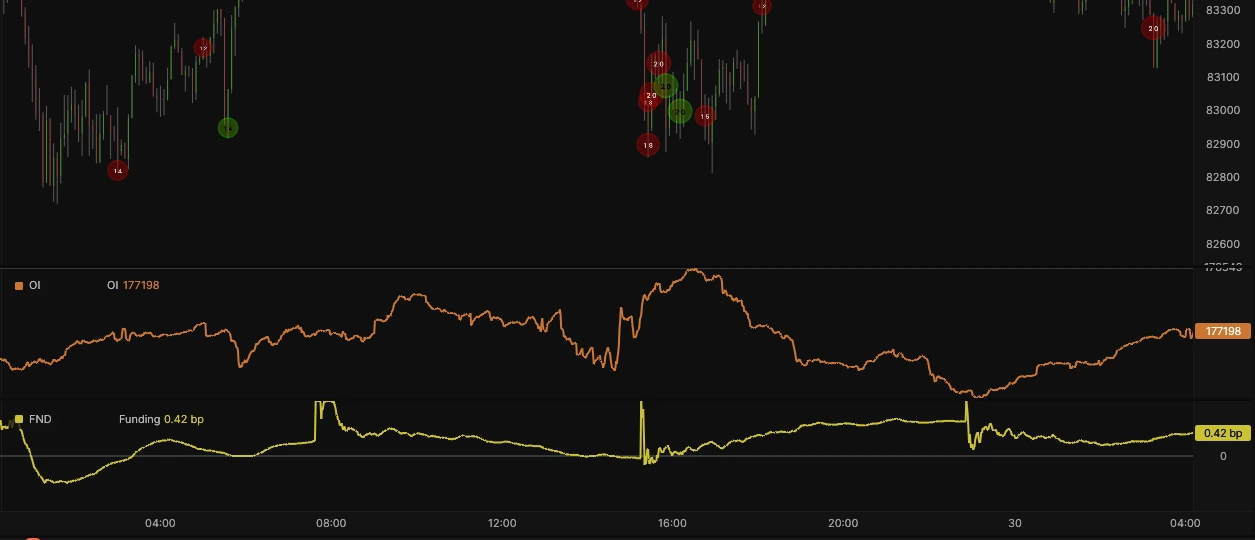
The context that usually lives in a second tool: liquidations, funding, open interest, the basis between spot and perpetual, and dealer gamma from options.
- Liquidations
- Funding, open interest and basis
- Options gamma exposure
- Order flow by counterparty on Hyperliquid
- 06
VWAPs with their deviations
Session, weekly, monthly, quarterly and yearly VWAPs, anchored and fixed-range VWAPs, and a rolling VWAP, each with three standard-deviation bands. A deviation panel and divergences tell you how stretched price is and whether the move has volume behind it.
- Three σ bands on every VWAP
- Restarts at the session open you pick
- Computed from traded prices, not candles
- Estimated stretches drawn fainter
- 07
Build once, share, trust
A script is a package with a name, a version and the permissions it asks for. Share it, remix it, and let anyone reproduce its result.
- Alerts as notification, sound, voice, Discord, Telegram or a webhook
- A public script library with remixes and versions
- Replay links that open the same symbol, minute and layout
- Pine Script converter for the common subset
- Flagship scripts: gamma-wall absorption, spoof-wall hunter, liquidation-cascade thermometer
- 08
A workstation, not a chart
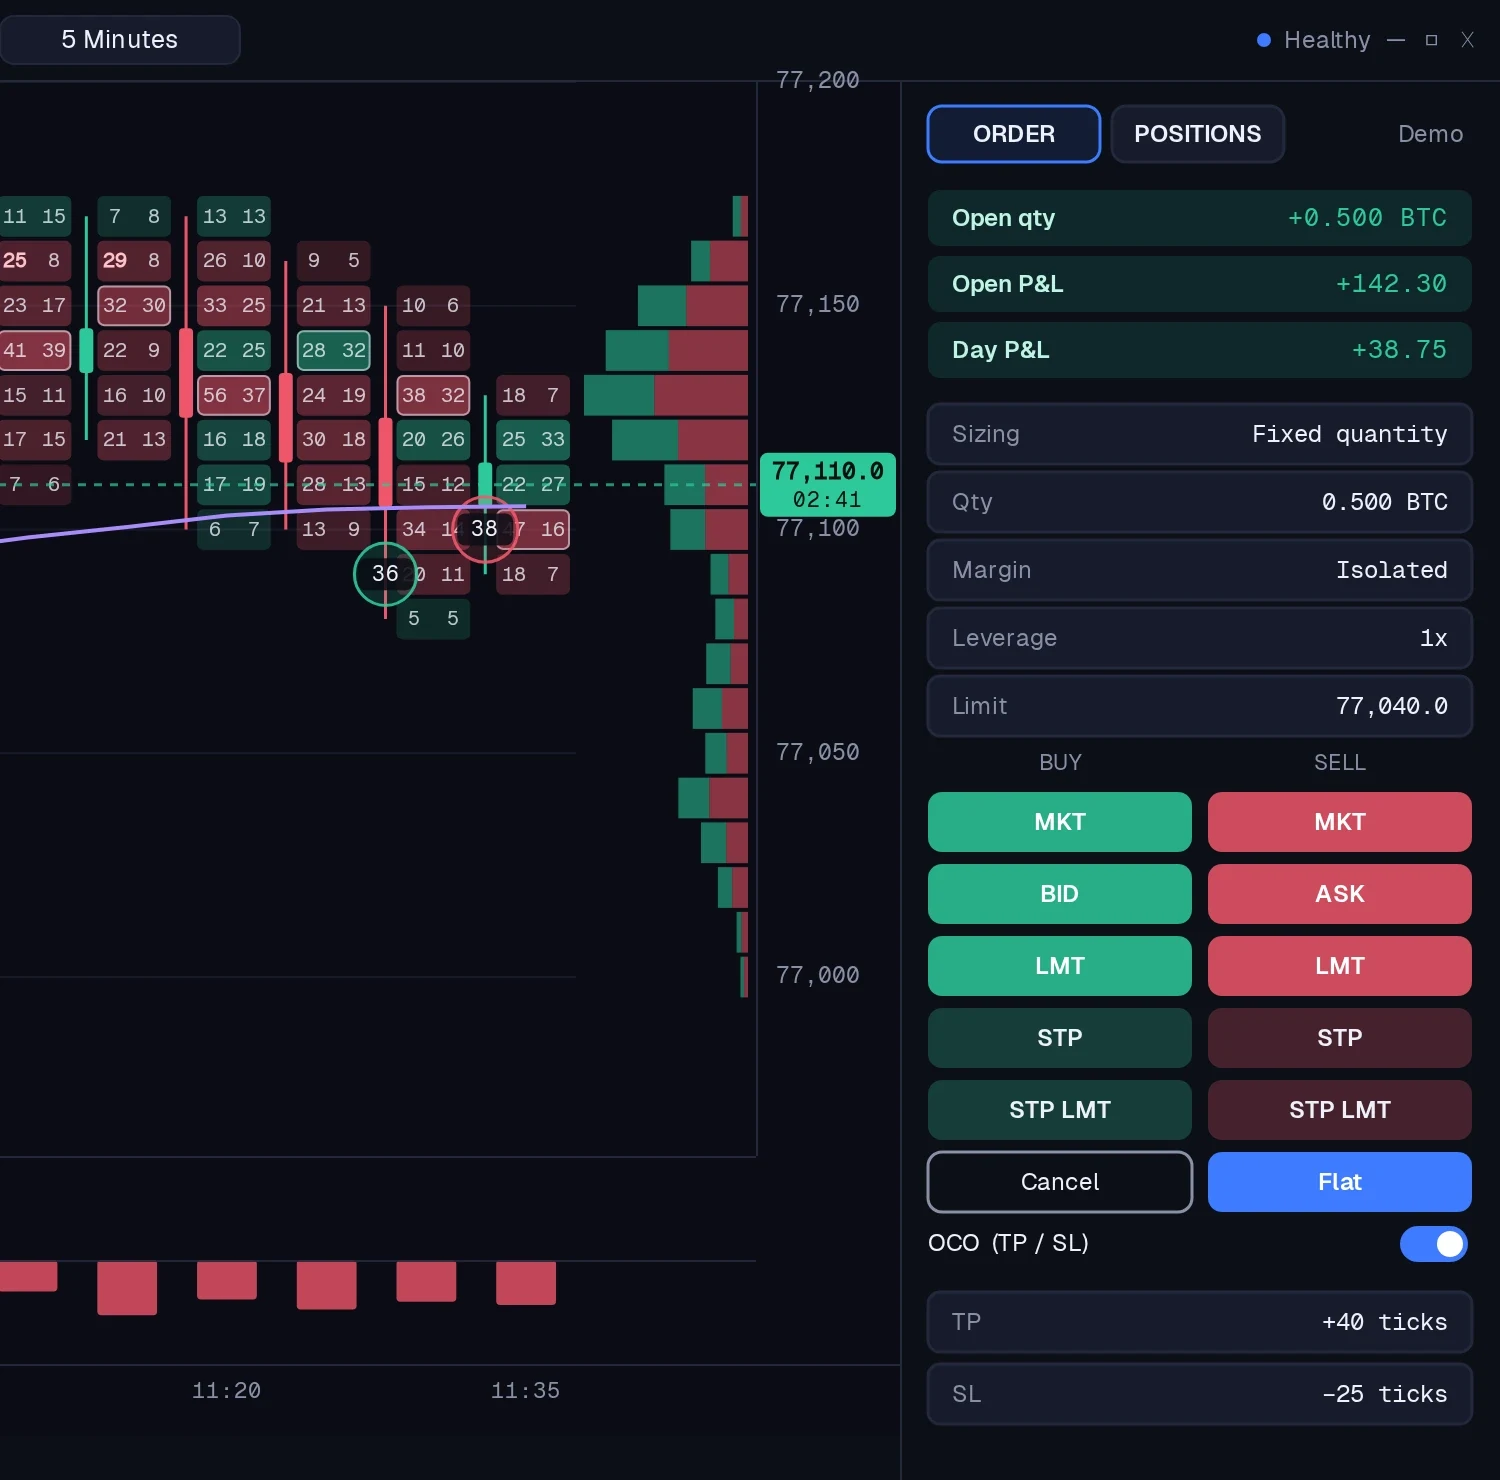
Everything you place and arrange is yours: a layout of as many charts as you like, saved continuously, with a demo account to practise on stored data.
- 85 drawing tools, 61 indicators
- 15 chart layers and 8 bar types
- Workspace and demo trades autosaved
- Native desktop, GPU-rendered
- 09
Data that says what it did not see
A gap in capture is drawn as a gap. A value that was not measured is labelled as not measured. An inference is labelled as an inference. The aim is that the screen never looks more certain than the data is.
- Capture gaps recorded and drawn
- Unmeasured values labelled
- Spot and perpetual never mixed
How it runs
Measured on our own laptop (Core i7, 16 GB, RTX 2060, Linux), release builds. These are TTT's own numbers: we have not run another product through the same test.
- 0.33 – 0.5 s
- First frame after launch
- 2.1 s
- Eight charts, each with bars
- 2.4 – 4 ms
- Frame cost, one chart (median)
- ≈ 360 – 390 MB
- Memory, one footprint chart
- 444 MB
- Memory, everything on at once
- 17 ms
- Revisiting a timeframe
- 32, 4.6 ms median
- Charts open at once (tested)
- 200
- Terminals on one backend (tested)
Capacity figures use a simulated venue speaking a real exchange's protocol. The real market averaged 26 trades a second on the busiest instrument we capture.
How it compares
Where TTT stands against the tools traders use for order flow today, feature by feature. Where it does not lead, the table says so.
| Feature | TTT | TradingView | Bookmap | ATAS | Quantower | Exocharts | TradingLite | CoinGlass |
|---|---|---|---|---|---|---|---|---|
| Built only for crypto | Yes | No | No | No | No | Yes | Yes | Yes |
| FootprintTradingView: Premium plan | Yes | Yes | Partly | Yes | Yes | Yes | Yes | No |
| Liquidity heatmap with history | Yes | No | Yes | Yes | Yes | Not verified | Yes | Partly |
| Depth ladder | Yes | Partly | Yes | Yes | Yes | Yes | Not verified | No |
| Volume profile | Yes | Yes | Yes | Yes | Yes | Yes | Yes | Not verified |
| Liquidations | Yes | Partly | Not verified | Not verified | Not verified | Not verified | Not verified | Yes |
| Funding, open interest, basis | Yes | Partly | No | Not verified | Not verified | Not verified | Not verified | Yes |
| Options gamma | Yes | No | No | No | Not verified | No | No | Partly |
| Counterparty order flow (Hyperliquid) | Yes | No | Not verified | Not verified | Not verified | Not verified | Not verified | Not verified |
| ScriptingTTT: T0 Lang | Yes | Yes | Yes | Yes | Yes | Not verified | Yes | No |
| Paper trading | Yes | Yes | Yes | Yes | Yes | Not verified | No | No |
| Backtesting | Yes | Yes | No | Not verified | Yes | No | No | No |
| Native desktop app | Yes | Partly | Yes | Yes | Yes | Yes | No | No |
| Web or mobile | Partly | Yes | Not verified | Not verified | Not verified | Yes | Yes | Yes |
| Breadth of symbols and venues | Yes | Yes | Yes | Yes | Yes | Yes | Yes | Yes |
- Yes
- Partly
- No
- Not verified
Competitor cells come from each product's public pages and reviews, checked on 1 October 2026. “Not verified” means we did not confirm it, not that the product lacks it. Sierra Chart was not researched.
The TTT column describes the product at launch.
We do not claim TTT is faster or has better data than any of these: that has not been measured.